Real-Time Stream Processing with Amazon Managed Service for Apache Flink
Quick summary: Managed Flink for stateful streaming. July 2026 refresh — KDA name EOL, KPU + orchestration KPU, per-second billing, Flink vs Lambda decision matrix.
Key Takeaways
- July 2026 refresh — KDA name EOL, KPU + orchestration KPU, per-second billing, Flink vs Lambda decision matrix
- Engagement shape (anonymized): B2B SaaS fraud + session analytics, ~12k events/s peak on Kinesis, 4–8 KPUs steady after tuning ParallelismPerKPU, p95 under 5 seconds
- Reproduce this: Flink vs Lambda matrix · pipeline draw
- io Figure: Kinesis/MSK → Managed Flink (KPUs + checkpoints) → S3/DynamoDB/OpenSearch
- io What Is Amazon Managed Service for Apache Flink
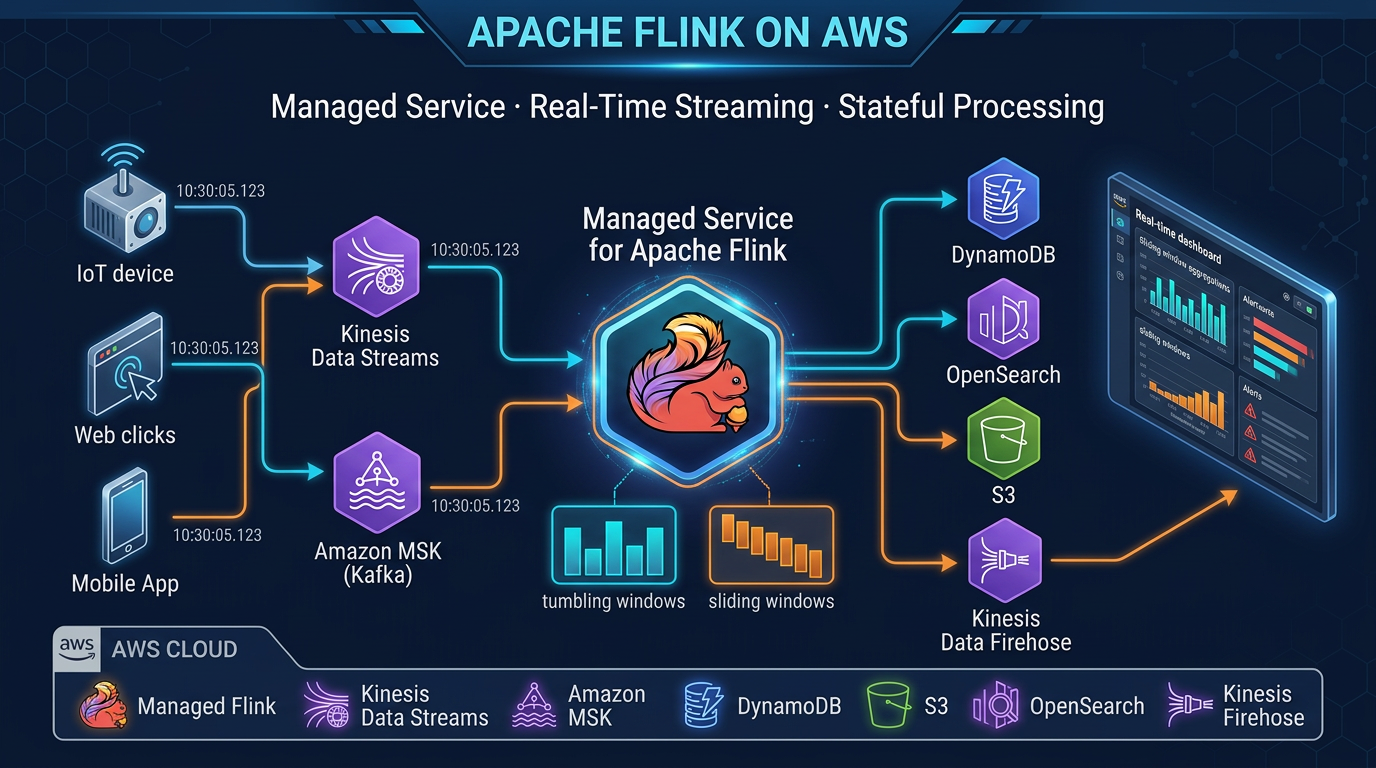
Table of Contents
Real-time stream processing used to mean running your own Flink cluster. Amazon Managed Service for Apache Flink still removes that ops tax — as of July 2026, with per-second KPU billing (short minimum), +1 orchestration KPU per application, and RocksDB-backed state with checkpoints to S3.
Engagement shape (anonymized): B2B SaaS fraud + session analytics, ~12k events/s peak on Kinesis, 4–8 KPUs steady after tuning ParallelismPerKPU, millisBehindLatest p95 under 5 seconds.
Reproduce this: Flink vs Lambda matrix · pipeline draw.io
Figure: Kinesis/MSK → Managed Flink (KPUs + checkpoints) → S3/DynamoDB/OpenSearch. Open draw.io
What Is Amazon Managed Service for Apache Flink?
Amazon Managed Service for Apache Flink is a fully managed service for running Apache Flink applications on AWS. AWS handles cluster provisioning, scaling, checkpointing to S3, and automatic failure recovery.
A brief history that matters: this service was previously called Amazon Kinesis Data Analytics for Apache Flink. AWS renamed it to Amazon Managed Service for Apache Flink in August 2023. The old Kinesis Data Analytics name officially reached end-of-life on January 27, 2026 — any documentation or tooling still referencing “Kinesis Data Analytics” is outdated. The current and correct name is Amazon Managed Service for Apache Flink.
What remains unchanged is the underlying engine: Apache Flink, the industry-standard stateful stream processing framework, with the full power of its Java/Scala DataStream API, Table API, and Flink SQL.
Apache Flink Core Concepts
Understanding Flink’s design principles is essential to using it effectively. These are not implementation details — they determine how you structure your application logic.
Streams as the Primitive
Flink treats all data as streams. A bounded dataset (a file, a table) is just a stream that ends. An unbounded stream (sensor readings, user events, transaction logs) never ends — Flink processes it continuously. This unifies batch and streaming into a single programming model.
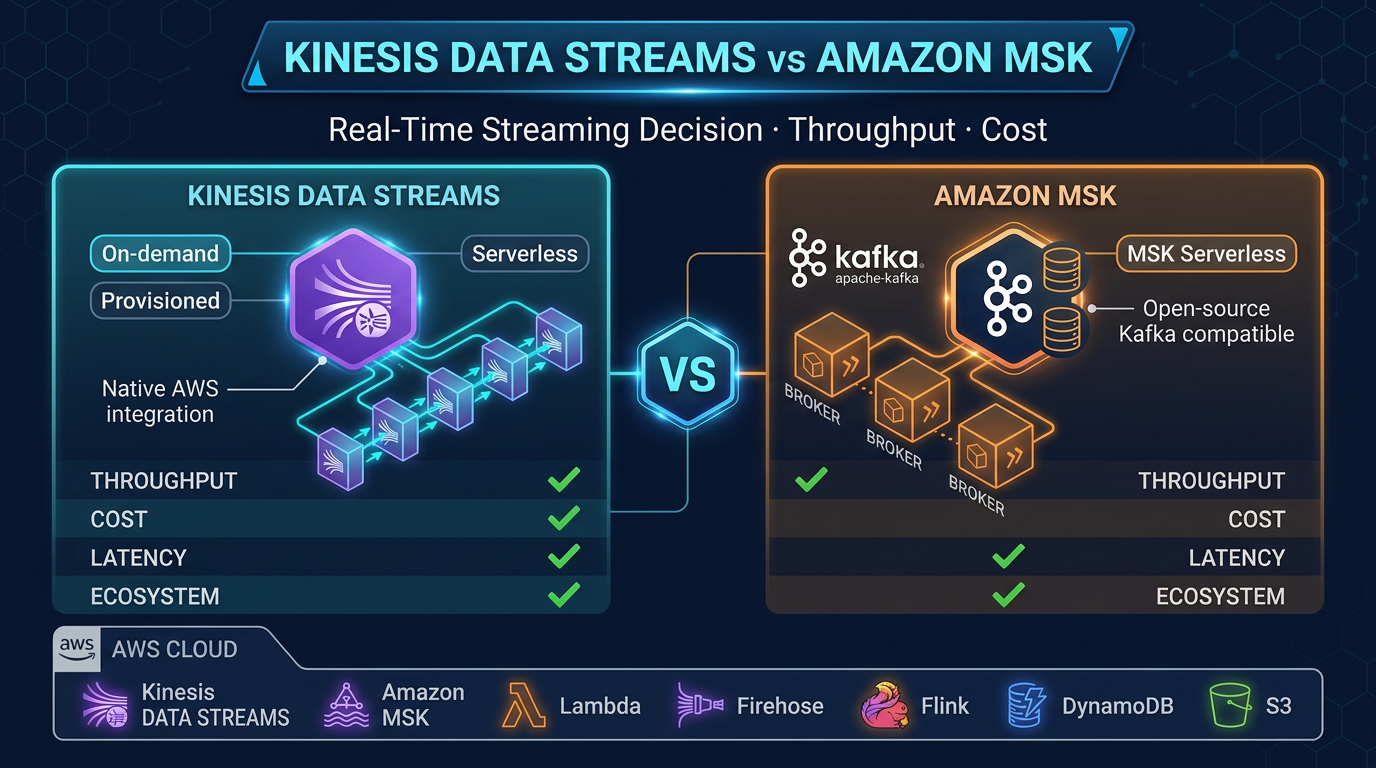
For streaming analytics on AWS, your stream source is typically Kinesis Data Streams or Amazon MSK (Managed Streaming for Apache Kafka). Events arrive continuously, and Flink processes each event as it arrives.
Stateful Computation
The defining capability that separates Flink from simple stream routers or transformers is state. Flink can maintain per-key state that accumulates across events over time. A running count of failed login attempts per user, the current balance of a bank account, a 7-day rolling average of request latency — all of these require state.
Flink stores state in a configurable state backend:
- HashMap state backend: In-memory. Fast reads and writes. Limited by available heap memory. Suitable for small state (tens of GB total).
- RocksDB state backend: On-disk (SSD), with a write-through cache. Handles state of hundreds of GB to terabytes. Required for large keyed state. Slightly higher latency than HashMap.
Amazon Managed Service for Apache Flink uses RocksDB as the default state backend for production applications.
Event Time vs Processing Time
Every event has two times: when it actually occurred (event time, embedded in the event payload) and when Flink received it (processing time, wall clock).
Processing time is simpler: no coordination required, no concept of late events. Use it when approximate results are acceptable and events arrive in near-real-time order.
Event time is more powerful: results are consistent regardless of network delays, retries, or reprocessing. Required for accurate time-window aggregations in production (especially fraud detection, financial reporting, and SLA monitoring). Event time processing requires watermarks — signals that tell Flink when to consider a time window complete.
Watermarks
A watermark is Flink’s mechanism for handling out-of-order events in event time processing. A watermark of time T means “I believe all events with timestamps ≤ T have arrived.” When Flink receives a watermark that advances past a window’s end time, it closes and emits that window.
Configure watermarks based on your expected maximum event latency. A watermark strategy of maxOutOfOrderliness = 5 seconds means Flink waits up to 5 seconds after the window’s end before emitting results, allowing late events to arrive. Events that arrive after the watermark is past their timestamp are considered late — Flink can either drop them or send them to a side output for separate handling.
Exactly-Once Semantics
Flink achieves exactly-once processing through a combination of:
- Checkpointing: periodic snapshots of all operator state and source offsets
- Transactional sinks: sinks that participate in Flink’s two-phase commit protocol (Kinesis Data Streams and Amazon Data Firehose support this)
With exactly-once semantics, no event is processed twice and no event is lost, even if the application crashes and restarts mid-processing.
Architecture on AWS
The typical Amazon Managed Service for Apache Flink architecture:
Event Sources
  ├── Kinesis Data Streams (application events, IoT, clickstream)
  └── Amazon MSK (enterprise Kafka workloads, CDC from Debezium)
          │
          ▼
  Amazon Managed Service for Apache Flink
  ├── Source operator (FlinkKinesisConsumer / KafkaSource)
  ├── Transformation operators (filter, map, keyBy, window, aggregate)
  ├── State backend (RocksDB → S3 checkpoints)
  └── Sink operator
          │
    ┌─────┼─────────────────────────┐
    ▼     ▼                         ▼
Amazon  Amazon Data          Amazon DynamoDB
 MSK    Firehose               (low-latency
(fan-   → S3 data lake          lookup API)
 out)   → Redshift
        → OpenSearch
Flink sits in the center as the processing layer. It does not store data permanently — it reads from sources, processes, and writes to sinks. The sources and sinks are managed services; Flink provides the transformation logic in between.
KPU Sizing and Scaling
What Is a KPU?
1 KPU (Kinesis Processing Unit) = 1 vCPU + 4 GB memory. The Managed Flink service uses KPUs as its compute unit, consistent with the broader Kinesis family.
Parallelism and KPUs
Your application’s parallelism setting determines how many parallel task slots Flink uses. AWS provisions the KPUs to satisfy that parallelism. A parallelism of 4 requires at least 4 KPUs (assuming 1 task slot per KPU — the default).
For a Kinesis source, effective parallelism is bounded by the number of shards: a 4-shard Kinesis stream can be consumed by at most 4 parallel source tasks. Set your source parallelism to match your shard count, then scale shard count and Flink parallelism together as throughput grows.
Sizing starting point: 1 KPU per 1 MB/s of input event throughput is a reasonable starting estimate. Tune empirically based on observed CPU utilization and checkpoint duration metrics.
Auto Scaling
Amazon Managed Service for Apache Flink integrates with AWS Application Auto Scaling. Configure min and max KPU counts and a scaling policy:
{
  "ServiceNamespace": "kinesisanalytics",
  "ResourceId": "application/MyFlinkApp",
  "ScalableDimension": "kinesisanalytics:application:KPU",
  "MinCapacity": 2,
  "MaxCapacity": 32
}
Define a target tracking policy based on KPUs metric or a custom CloudWatch metric (like numRecordsInPerSecond). Flink state is preserved across scaling events because Flink takes a checkpoint before scaling, restores state from that checkpoint on the new configuration, and resumes processing from where it left off.
Core Flink Programming Patterns
Pattern 1: Stateless Transform (Filter, Enrich)
The simplest pattern — no state, no windows. Process each event independently.
DataStream<OrderEvent> orders = env.fromSource(
    kinesisSource,
    WatermarkStrategy.noWatermarks(),
    "Kinesis Order Events"
);

// Filter: only process completed orders
DataStream<OrderEvent> completedOrders = orders
    .filter(order -> "COMPLETED".equals(order.getStatus()));

// Enrich: add a computed field
DataStream<EnrichedOrder> enriched = completedOrders
    .map(order -> new EnrichedOrder(
        order,
        calculateRevenueTier(order.getAmount())
    ));
Pattern 2: Keyed Stateful Aggregation
Group events by key, maintain per-key state, and aggregate.
// Count orders per customer (running total, stateful)
DataStream<CustomerOrderCount> counts = orders
    .keyBy(order -> order.getCustomerId())
    .process(new KeyedProcessFunction<String, OrderEvent, CustomerOrderCount>() {
        private ValueState<Long> countState;

        @Override
        public void open(Configuration parameters) {
            countState = getRuntimeContext().getState(
                new ValueStateDescriptor<>("order-count", Long.class, 0L)
            );
        }

        @Override
        public void processElement(
            OrderEvent event,
            Context ctx,
            Collector<CustomerOrderCount> out
        ) throws Exception {
            Long count = countState.value() + 1;
            countState.update(count);
            out.collect(new CustomerOrderCount(event.getCustomerId(), count));
        }
    });
This maintains a per-customer order count in RocksDB state. The count persists across application restarts (restored from checkpoints).
Pattern 3: Tumbling Window Aggregation
Fixed, non-overlapping time windows. Classic “count events per 5-minute window” pattern.
DataStream<ProductRevenue> revenuePerWindow = orders
    .assignTimestampsAndWatermarks(
        WatermarkStrategy
            .<OrderEvent>forBoundedOutOfOrderness(Duration.ofSeconds(10))
            .withTimestampAssigner((event, ts) -> event.getOrderTimestamp())
    )
    .keyBy(order -> order.getProductId())
    .window(TumblingEventTimeWindows.of(Duration.ofMinutes(5)))
    .aggregate(new RevenueAggregator());
TumblingEventTimeWindows.of(Duration.ofMinutes(5)) creates 5-minute windows aligned to the epoch (00:00, 00:05, 00:10…). When the watermark advances past a window’s end, Flink triggers the aggregator and emits one result per product per window.
Pattern 4: Sliding Window (Rolling Averages)
Overlapping windows for rolling metrics.
// Rolling 5-minute average, recomputed every 1 minute
DataStream<LatencyMetric> rollingAvg = requestEvents
    .assignTimestampsAndWatermarks(...)
    .keyBy(event -> event.getEndpointId())
    .window(SlidingEventTimeWindows.of(
        Duration.ofMinutes(5),   // window size
        Duration.ofMinutes(1)    // slide interval
    ))
    .aggregate(new LatencyAverageAggregator());
A 5-minute window sliding every 1 minute: each event appears in 5 overlapping windows. This gives you a metric updated every minute that reflects the past 5 minutes of data — ideal for P95 latency dashboards.
Pattern 5: Complex Event Processing (CEP)
Detect sequences of events across time — the pattern underlying fraud detection, intrusion detection, and operational alerting.
import org.apache.flink.cep.CEP;
import org.apache.flink.cep.pattern.Pattern;
import org.apache.flink.cep.pattern.conditions.SimpleCondition;

// Detect 3 failed logins within 60 seconds per user
Pattern<LoginEvent, ?> bruteForcePattern = Pattern
    .<LoginEvent>begin("first-failure")
        .where(new SimpleCondition<LoginEvent>() {
            public boolean filter(LoginEvent event) {
                return "FAILED".equals(event.getStatus());
            }
        })
    .next("second-failure")
        .where(new SimpleCondition<LoginEvent>() {
            public boolean filter(LoginEvent event) {
                return "FAILED".equals(event.getStatus());
            }
        })
    .next("third-failure")
        .where(new SimpleCondition<LoginEvent>() {
            public boolean filter(LoginEvent event) {
                return "FAILED".equals(event.getStatus());
            }
        })
    .within(Duration.ofSeconds(60));

PatternStream<LoginEvent> patternStream = CEP.pattern(
    loginEvents.keyBy(LoginEvent::getUserId),
    bruteForcePattern
);

DataStream<SecurityAlert> alerts = patternStream.select(
    matchedEvents -> new SecurityAlert(
        matchedEvents.get("third-failure").get(0).getUserId(),
        "BRUTE_FORCE_ATTEMPT",
        Instant.now()
    )
);
CEP matches event sequences per key (per user in this case). The pattern requires three consecutive FAILED events within 60 seconds. Match → emit a SecurityAlert to your alerts sink (SNS, DynamoDB, OpenSearch).
Flink SQL for Simpler Streaming
Flink SQL allows you to express streaming queries as SQL — familiar to analysts and engineers who know SQL but not the Java DataStream API. Flink compiles SQL queries into optimized Flink operators.
-- Create a Kinesis source table (Flink SQL DDL)
CREATE TABLE login_events (
    user_id     STRING,
    event_type  STRING,
    ip_address  STRING,
    event_time  TIMESTAMP(3),
    WATERMARK FOR event_time AS event_time - INTERVAL '5' SECOND
) WITH (
    'connector' = 'kinesis',
    'stream'    = 'login-events-stream',
    'aws.region' = 'us-east-1',
    'scan.stream.initpos' = 'LATEST',
    'format'    = 'json'
);

-- Count failed logins per user per 5-minute tumbling window
SELECT
    user_id,
    COUNT(*) AS failed_attempts,
    TUMBLE_START(event_time, INTERVAL '5' MINUTES) AS window_start,
    TUMBLE_END(event_time,   INTERVAL '5' MINUTES) AS window_end
FROM login_events
WHERE event_type = 'LOGIN_FAILED'
GROUP BY
    user_id,
    TUMBLE(event_time, INTERVAL '5' MINUTES)
HAVING COUNT(*) >= 3;
Flink SQL is an excellent choice for streaming ETL, aggregations, and simple pattern matching. For complex stateful logic, custom CEP patterns, or operations requiring fine-grained control over state management, the DataStream API is more expressive.
Checkpointing Configuration
Checkpointing is how Flink achieves fault tolerance. Configure it deliberately rather than relying on defaults.
StreamExecutionEnvironment env = StreamExecutionEnvironment.getExecutionEnvironment();

// Enable checkpointing every 2 minutes
env.enableCheckpointing(120_000);

CheckpointConfig config = env.getCheckpointConfig();

// Exactly-once semantics (default)
config.setCheckpointingMode(CheckpointingMode.EXACTLY_ONCE);

// At least 30 seconds between checkpoints (prevents checkpoint overlap)
config.setMinPauseBetweenCheckpoints(30_000);

// Checkpoint must complete within 5 minutes or it is discarded
config.setCheckpointTimeout(300_000);

// Keep the last 2 checkpoints on failure for manual recovery
config.setMaxConcurrentCheckpoints(1);
config.enableExternalizedCheckpoints(
    ExternalizedCheckpointCleanup.RETAIN_ON_CANCELLATION
);

// Use RocksDB for large-state applications
env.setStateBackend(new EmbeddedRocksDBStateBackend());
Checkpoint interval guidance:
- 30 seconds: aggressive, fast recovery, higher ongoing overhead. Use for low-latency SLAs (sub-minute recovery time objective).
- 2-5 minutes: balanced. Good for most production applications.
- 10+ minutes: minimal overhead. Use only for very high-throughput applications where checkpoint overhead is measurable.
Checkpoint state is stored in S3. Amazon Managed Service for Apache Flink provisions the S3 bucket and manages retention automatically. You do not need to configure the S3 destination.
Integration with Kinesis Data Streams
Kinesis Data Streams is the most common source for Managed Flink applications on AWS.
<!-- Maven dependency for Kinesis connector -->
<dependency>
    <groupId>org.apache.flink</groupId>
    <artifactId>flink-connector-kinesis</artifactId>
    <version>4.3.0-1.19</version>
</dependency>KinesisSourceBuilder<String> builder = KinesisSource.builder()
.setStreamArn("arn:aws:kinesis:us-east-1:123456789:stream/order-events")
.setDeserializationSchema(new SimpleStringSchema())
.setStartingPosition(InitialPosition.LATEST);
DataStream<String> kinesisStream = env.fromSource(
builder.build(),
WatermarkStrategy.noWatermarks(),
"Kinesis Source"
);For writing results back to Kinesis Data Streams:
KinesisSink<String> kinesisSink = KinesisSink.<String>builder()
    .setStreamArn("arn:aws:kinesis:us-east-1:123456789:stream/processed-alerts")
    .setSerializationSchema(new SimpleStringSchema())
    .setPartitionKeyGenerator(element -> String.valueOf(element.hashCode()))
    .build();

alerts.sinkTo(kinesisSink);
For writing to S3 via Amazon Data Firehose:
KinesisFirehoseSink<String> firehoseSink = KinesisFirehoseSink.<String>builder()
    .setDeliveryStreamName("processed-events-to-s3")
    .setSerializationSchema(new SimpleStringSchema())
    .build();

enrichedStream.sinkTo(firehoseSink);
Amazon Data Firehose handles the buffering, batching, and S3 write from there — converting JSON to Parquet, partitioning by date, and registering with the Glue Data Catalog for Athena queries downstream.
Common Production Use Cases
Real-time fraud detection: CEP patterns detect suspicious transaction sequences (card testing: multiple small transactions in rapid succession before a large purchase). Alert within milliseconds of the trigger event. Write to DynamoDB for immediate lookup in your payment authorization flow.
Streaming ETL: Kinesis → Flink (enrich with product catalog, normalize schema, filter test events) → Amazon Data Firehose → S3 Parquet → Athena. The data lake receives clean, enriched data without a separate batch ETL job. Latency from event to queryable S3 is typically 60-120 seconds (Firehose buffer).
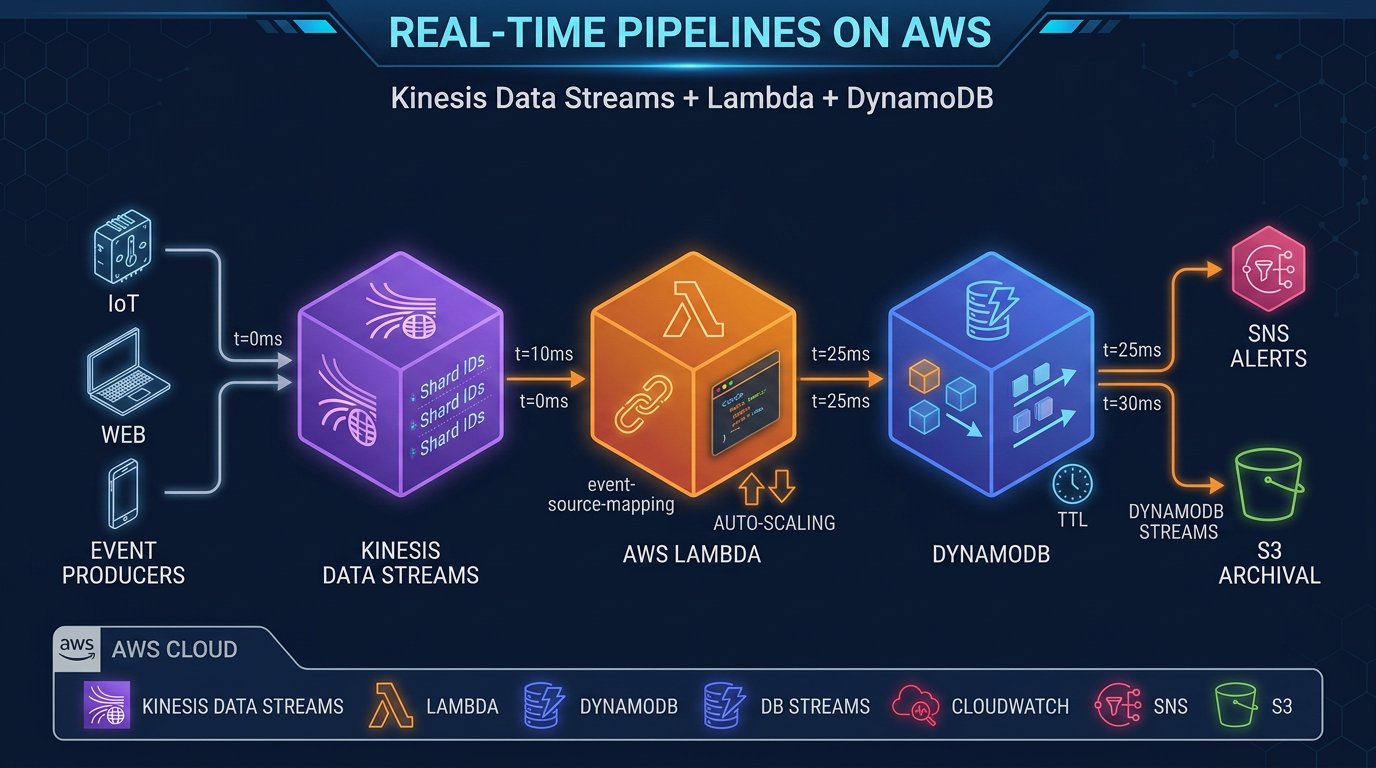
Real-time dashboards: Flink aggregates metrics (revenue per minute, active users, error rate) into tumbling windows, writes results to DynamoDB with TTL. A REST API reads DynamoDB for sub-10ms dashboard queries. QuickSight or a custom frontend polls the API. This pattern scales to millions of events per second — the dashboard reads from DynamoDB, not from the raw stream.
Anomaly detection: Statistical models running in Flink operator state detect deviations from historical baseline (request latency 3 standard deviations above the rolling mean). Flink maintains the rolling statistics as operator state; each new event updates the state and triggers an alert if the deviation threshold is exceeded.
Event-driven microservice orchestration: Flink joins two streams (order events + inventory events) and emits fulfillment triggers when an order can be satisfied by available inventory. The join is a temporal stream-stream join: match order and inventory events within a 30-second window. This replaces a polling-based database query with a push-based streaming join.
Development Workflow
Local development: Use LocalStreamEnvironment to run your Flink application locally against test data or a local Kinesis Data Streams mock:
StreamExecutionEnvironment env = StreamExecutionEnvironment.createLocalEnvironment();
// Use a collection source for testing
DataStream<OrderEvent> testOrders = env.fromElements(
    new OrderEvent("O001", "C001", 99.99, "COMPLETED"),
    new OrderEvent("O002", "C001", 149.99, "COMPLETED")
);
Run unit tests against individual operators using Flink’s MiniClusterWithClientResource test utility. Test window operations against synthetic timestamped events without requiring a live stream.
Staging: Deploy to a Managed Flink application with a development Kinesis stream. Send synthetic load using the kinesis-data-generator tool (open source, available on GitHub) to simulate production throughput patterns.
Production: Package your application as a fat JAR (Maven shade plugin or Gradle shadow plugin), upload to S3, and configure the Managed Flink application to reference it:
# Build fat JAR
mvn package -Pbuild-jar

# Upload to S3
aws s3 cp target/flink-app-1.0.jar s3://my-flink-apps/flink-app-1.0.jar

# Deploy to Managed Flink (AWS CLI)
aws kinesisanalyticsv2 update-application \
  --application-name MyFlinkApp \
  --current-application-version-id 1 \
  --application-configuration-update \
    CodeContentUpdate="{S3ContentLocationUpdate={BucketARNUpdate=arn:aws:s3:::my-flink-apps,FileKeyUpdate=flink-app-1.0.jar}}"
Monitoring and Observability
Amazon Managed Service for Apache Flink emits CloudWatch metrics automatically. The critical metrics for production operations:
| Metric | What It Tells You | Alert Condition |
|---|---|---|
numRecordsInPerSecond | Input throughput | Drop to 0 = source issue |
numRecordsOutPerSecond | Output throughput | Drop unexpectedly = processing issue |
millisBehindLatest | Lag behind Kinesis shard head | > 60,000 ms = consumer is behind |
lastCheckpointDuration | Time for last checkpoint to complete | > checkpoint interval = checkpoint overlap risk |
numberOfFailedCheckpoints | Checkpoint failures | Any > 0 = investigate immediately |
uptime | Continuous runtime without restart | Resets on failure/restart |
fullRestarts | Number of automatic restarts | Any > 0 = application is failing |
Set CloudWatch alarms on:
millisBehindLatest> 60,000: consumer is more than a minute behind — either throughput spike or processing bottlenecknumberOfFailedCheckpoints> 0: a failed checkpoint means the next restart will replay more events than expectedfullRestarts> 0: the application crashed; investigate logs immediatelylastCheckpointDuration> 80% of checkpoint interval: checkpoint is taking too long; risk of overlap and increased processing overhead
Enable Managed Flink application logging to CloudWatch Logs for application-level debugging. Set the log level to WARN in production to avoid log volume costs from INFO-level Flink framework messages.
When this advice fails
- Stateless filter/enrich only — Lambda (or EventBridge Pipes) is cheaper and simpler; see the decision matrix.
- You leave Studio notebooks as “production” — export to a standard Managed Flink application with CI-deployed JARs.
- Checkpoint duration ≈ interval — you will overlap checkpoints and amplify lag; fix state size / ParallelismPerKPU before adding KPUs blindly.
What this post doesn’t cover
Flink SQL CDC into Iceberg table maintenance, and MSK IAM auth deep-dives — see the Kinesis vs MSK compare post.
What to do Monday morning
- Confirm no tooling still targets the retired Kinesis Data Analytics name/APIs for new work.
- Alarm on
millisBehindLatest,numberOfFailedCheckpoints,fullRestarts. - Calculate KPUs = ceil(Parallelism / ParallelismPerKPU) + 1 orchestration KPU; verify $/hr on the pricing page.
- Prefer event-time windows with watermarks for any late-data SLA.
- Use Studio for exploration; promote a fat JAR to production.
- Walk the Flink vs Lambda matrix before the next streaming project.
AWS Cloud Architect & AI Expert
AWS-certified cloud architect and AI expert with deep expertise in cloud migrations, cost optimization, and generative AI on AWS.