Amazon QuickSight in Production: A Practical Guide for BI Teams
Quick summary: Amazon QuickSight can replace expensive BI tools or become a costly mistake — depending on how you use it. Here is the production guide that covers SPICE, multi-tenancy, cost control, and the cases where QuickSight is the wrong choice.
Key Takeaways
- Amazon QuickSight can replace expensive BI tools or become a costly mistake — depending on how you use it
- Business intelligence on AWS should be straightforward
- You have data in S3, Redshift, or Athena — QuickSight connects to it, and your executives get dashboards
- What Amazon QuickSight Actually Is QuickSight is AWS's cloud-native, serverless BI service
- Readers (dashboard consumers) pay up to $5/month regardless of how many sessions they initiate
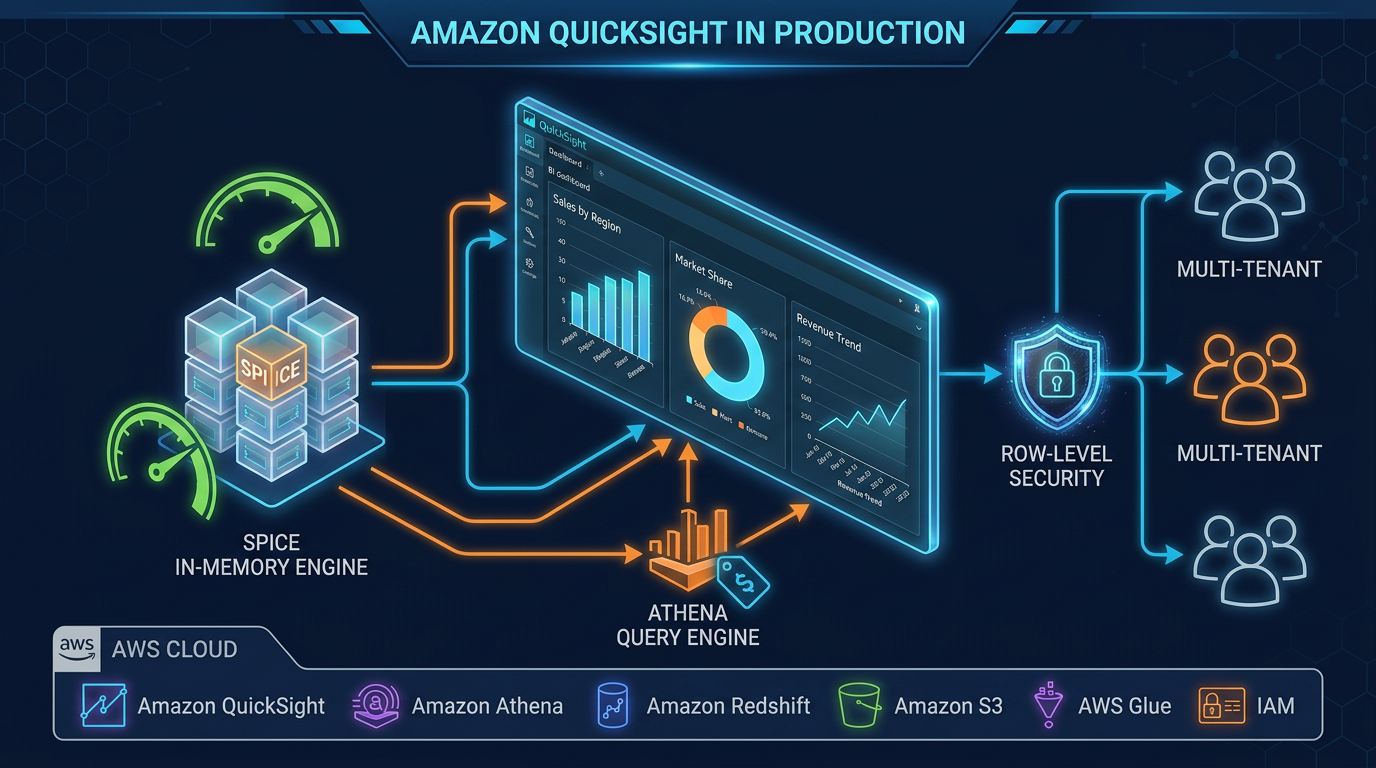
Table of Contents
Business intelligence on AWS should be straightforward. You have data in S3, Redshift, or Athena — QuickSight connects to it, and your executives get dashboards. In practice, the gap between that promise and production reality is where projects fail: SPICE fills up at inconvenient times, row-level security rules are mis-configured and expose the wrong data, embedded dashboards hit unexpected session limits, and Athena query costs spiral because every dashboard render is a full table scan.
This guide is written from production deployments across financial services, healthcare, and SaaS clients — not from the QuickSight documentation. It covers what works, what breaks at scale, and when to choose a different tool entirely.
What Amazon QuickSight Actually Is
QuickSight is AWS’s cloud-native, serverless BI service. Its defining characteristic — the one that separates it from every other BI tool — is the pricing model: per-reader sessions, not per-seat licenses. Readers (dashboard consumers) pay up to $5/month regardless of how many sessions they initiate. Authors (dashboard builders) pay a fixed monthly fee per user.
This makes QuickSight economically compelling for large organizations with many occasional readers and a small authoring team. It becomes economically unattractive when the ratio inverts.
The second defining characteristic is SPICE — QuickSight’s in-memory query engine. Understanding SPICE architecture is the single most important factor in a successful QuickSight deployment.
When QuickSight Is the Right Choice
QuickSight fits well in these scenarios:
Large read audiences on AWS data. If your data lives in S3, Redshift, Athena, or RDS, and you have hundreds to thousands of occasional dashboard consumers, QuickSight’s session pricing model is hard to beat. The AWS-native integration means no egress costs, no connector licensing, and IAM-based access control.
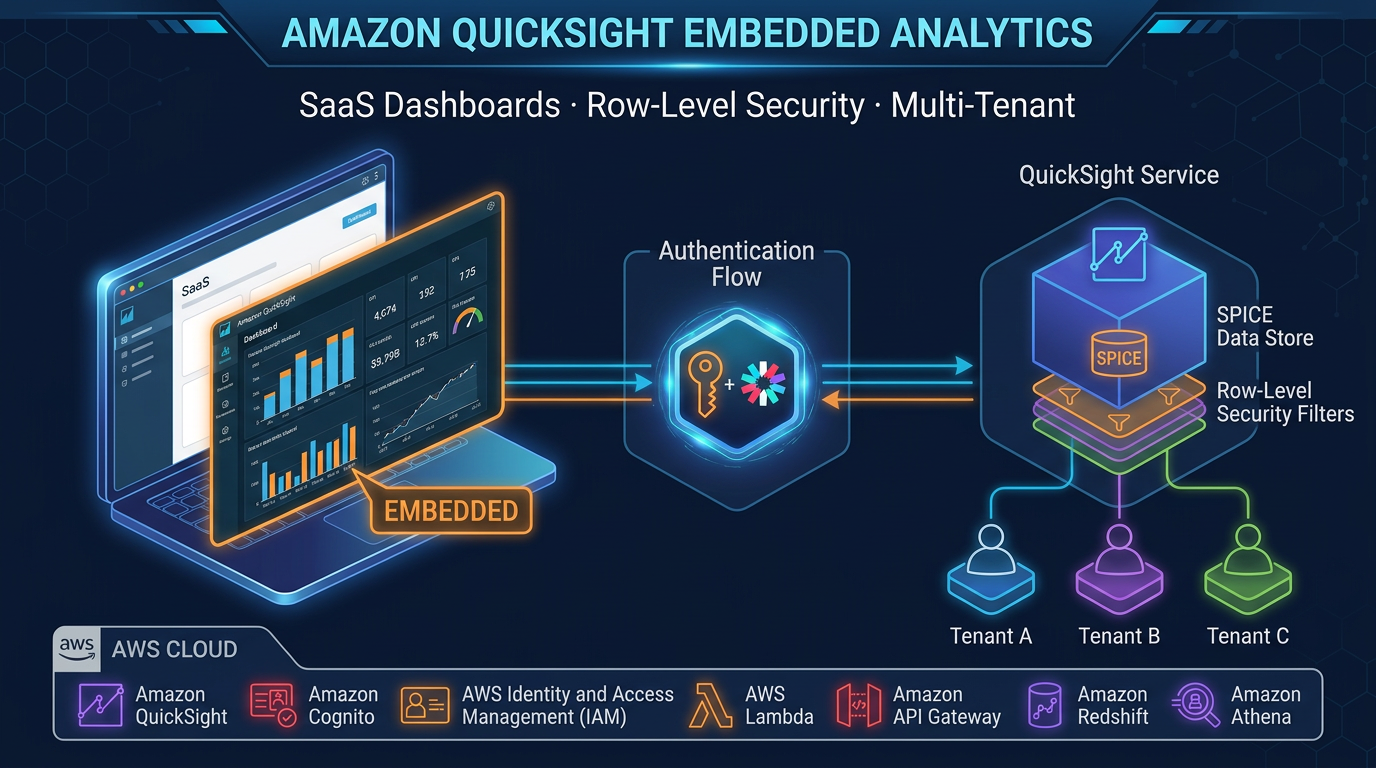
Embedded analytics in SaaS applications. QuickSight’s Embedding SDK and anonymous embedding support multi-tenant dashboards embedded in your product without exposing users to the QuickSight UI. From client implementations, this is one of the most underutilized capabilities — it turns QuickSight into an analytics backend for your product rather than a standalone BI tool.
Regulated industries needing AWS-native data residency. QuickSight is HIPAA eligible, PCI-DSS compliant, and FedRAMP authorized. Data never leaves your AWS region. For healthcare and financial services teams that cannot use SaaS BI tools with external data egress, this is a genuine differentiator.
Operational dashboards on stable, high-cardinality data. SPICE handles hundreds of millions of rows efficiently. If your data model is well-designed and refresh cadence matches your business needs (hourly or daily), QuickSight delivers fast dashboards without running queries against your data warehouse on every page load.
When QuickSight Is the Wrong Choice
Be direct with stakeholders about these limitations before committing to QuickSight:
Pixel-perfect reporting. QuickSight is a dashboard tool. If business users need formatted, printable reports with precise layout control — invoice-style outputs, regulatory filings, scheduled PDF reports — QuickSight is the wrong tool. Consider Amazon RDS + a reporting layer or purpose-built reporting tools.
Complex self-service data modeling. Power BI’s DAX and Tableau’s Level of Detail expressions are significantly more expressive than QuickSight’s calculated fields. Analysts accustomed to complex cross-dataset calculations will find QuickSight’s calculation layer constraining. If your BI team writes complex business logic in the visualization layer, evaluate this carefully before migrating.
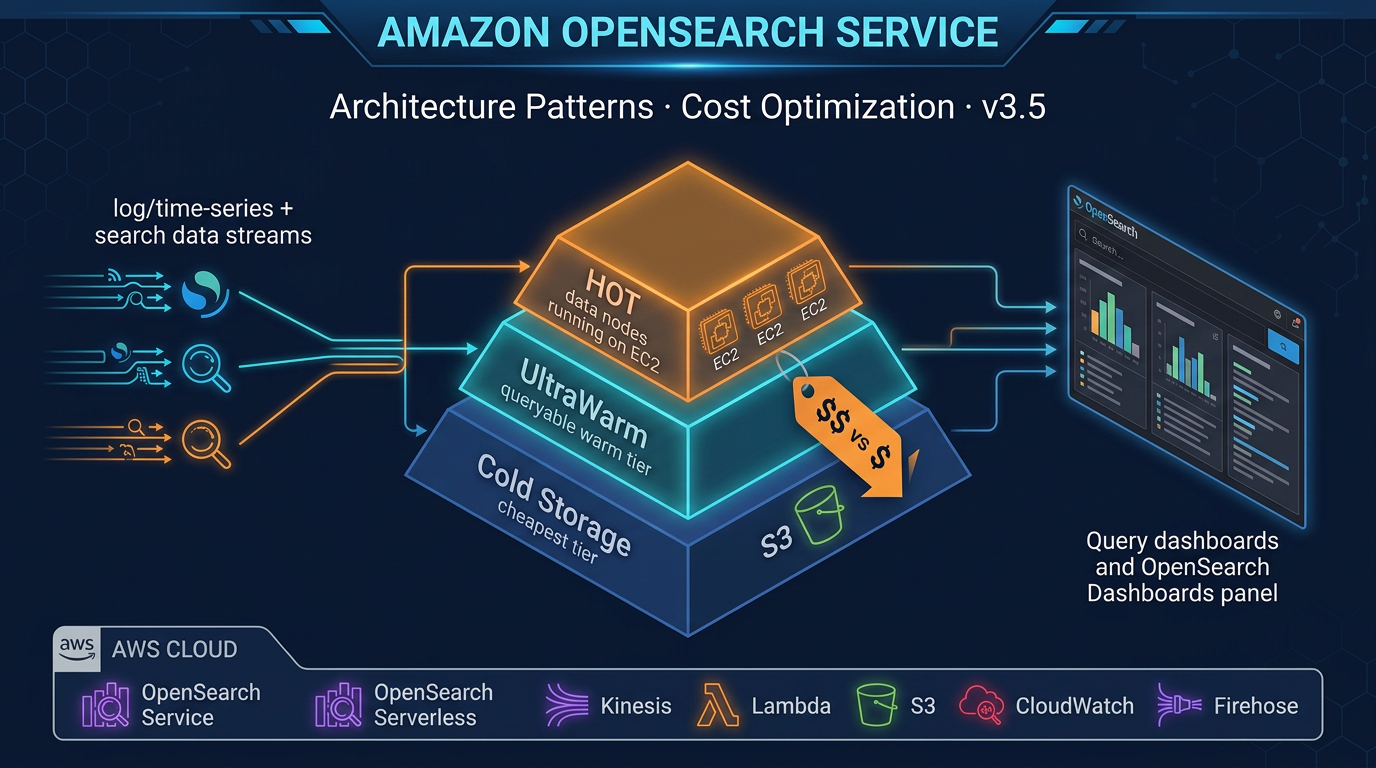
True real-time operational monitoring. QuickSight’s minimum SPICE refresh interval is 15 minutes. Direct Query adds latency from the round-trip to your data source. For dashboards that need sub-minute data freshness — infrastructure monitoring, live trading positions, active incident response — QuickSight is not the right tool. Use Grafana with Amazon Managed Service for Prometheus or OpenSearch Dashboards.
Heavy ML or statistical visualization. QuickSight’s ML Insights (anomaly detection, forecasting) are useful for basic pattern detection but limited for teams that need custom statistical models, confidence intervals across complex distributions, or integration with SageMaker experiment results. Jupyter notebooks with Plotly or Streamlit serve this audience better.
SPICE vs Direct Query: The Most Important Decision
Every QuickSight dataset is either ingested into SPICE or runs Direct Query against the source. Getting this choice wrong is the root cause of most QuickSight performance and cost problems.
Use SPICE when:
- Your dataset refreshes on a predictable schedule (hourly, daily, weekly)
- You have many concurrent readers — SPICE serves all of them from in-memory cache with no additional source queries
- Your source is Athena or S3 — paying per query scan on every dashboard load destroys your cost model
- Dataset size fits within your purchased SPICE capacity (currently up to 250 GB per dataset by default, expandable)
Use Direct Query when:
- You need live, real-time accuracy — financial positions, inventory counts, operational status
- Your dataset is too large for SPICE or changes too rapidly for scheduled refresh to be useful
- You are querying Redshift or Aurora with provisioned capacity already paid for — the marginal query cost is low
SPICE sizing and refresh strategy. In production environments, the most common SPICE mistake is full dataset refresh when incremental refresh is available. QuickSight supports incremental SPICE refresh using a date/datetime column — only rows modified since the last refresh are re-ingested. For large datasets with append-only patterns (event logs, transaction history), incremental refresh reduces both refresh duration and SPICE capacity consumption dramatically.
Monitor your SPICE utilization via CloudWatch metrics (SPICEUtilization). Purchase SPICE capacity in advance if usage is predictable — on-demand SPICE pricing is higher than reserved.
Row-Level Security: Implementation Patterns
Row-level security (RLS) is non-negotiable for multi-user deployments where different users should see different data subsets. QuickSight implements RLS through a rules dataset — a table mapping user identifiers to filter values.
username        | region       | account_id
----------------|--------------|------------
alice@acme.com  | us-east-1    | 123456
bob@acme.com    | eu-west-1    | 789012
When Alice loads a dashboard, QuickSight automatically filters all queries to region = 'us-east-1' AND account_id = '123456'. She cannot see Bob’s data even if she modifies the URL.
Tag-based RLS eliminates the need to maintain a static rules table. You define user attributes (tags) in QuickSight — for example ${department} or ${tenant_id} — and the filtering applies dynamically based on the authenticated user’s tag values. This is the preferred approach for embedded analytics where tenant context comes from your application’s authentication layer.
Critical implementation note: RLS rules are applied at the dataset level, not the dashboard level. If a dataset is shared without RLS, all users with access to that dataset see all rows — regardless of dashboard-level sharing permissions. Audit your dataset sharing permissions as carefully as your dashboard permissions.
Multi-Tenant Architecture Patterns
QuickSight supports two primary multi-tenancy patterns:
Namespace isolation creates a logical boundary within your QuickSight account. Each namespace has its own users, groups, IAM role, and can have its own SPICE capacity. Data assets in one namespace are invisible to users in another. This is the recommended pattern for SaaS products embedding QuickSight — each customer tenant maps to a namespace, and the Embedding SDK generates sessions scoped to that namespace.
Shared dataset with RLS uses a single dataset with row-level security to partition data by tenant. Simpler to operate — you manage one dataset instead of N — but requires rigorous RLS rules maintenance. A misconfigured rules row can expose data across tenants. In production environments with strict data isolation requirements, namespace isolation is safer.
For embedded analytics, combine namespace isolation with session tag-based RLS for dynamic filtering within the namespace. The embedding session passes the user’s tenant context as session tags, and QuickSight applies the corresponding filters without a static rules table.
Cost Optimization in Practice
QuickSight’s cost model has several levers that many teams leave unoptimized:
License right-sizing. Author licenses ($18–24/month) give users the ability to create and edit datasets, analyses, and dashboards. Reader licenses ($5/month session cap) are for consumption only. In most organizations, 10–20% of users need Author access. Audit quarterly — unused Author accounts are a common waste.
Athena query cost elimination. Every Direct Query dataset backed by Athena executes a full query scan on each dashboard load — charged at $5 per TB scanned. With 50 concurrent readers loading a dashboard that scans 100 GB, you are spending $25 per dashboard load. Moving Athena-backed datasets to SPICE with scheduled refresh often reduces costs by 80–90%. Partition your Athena tables by the most common filter columns (date, region, account_id) and use Parquet format to reduce scan volume for the inevitable Direct Query use cases.
SPICE incremental refresh. Full dataset refresh re-ingests all rows on every cycle. Incremental refresh ingests only changed rows. For a 200 million row transaction table with 50,000 new rows per day, incremental refresh reduces SPICE write volume by 99.975% — and corresponding refresh time from hours to minutes.
Embedded session management. Anonymous embedding charges per session. Design embed flows to avoid unnecessary session initiations — cache the embed URL in your application session rather than generating a new one on each page load. QuickSight anonymous embed URLs are valid for up to 15 minutes; coordinate your application session timeout with this window.
Dashboard Design for Technical and Executive Audiences
The most underinvested area in QuickSight deployments is dashboard design. A well-structured data model and fast SPICE queries are wasted if the dashboard is unreadable.
Separate executive and operational dashboards. Executive dashboards should answer one question per page: Are we on track? Operational dashboards need detail and filters. Trying to serve both audiences with one dashboard produces a dashboard that serves neither well.
Use parameters and controls for interactivity. QuickSight parameters drive cross-visual filters, URL actions, and calculated field overrides. A well-designed parameter-driven dashboard eliminates the need for multiple copies of the same dashboard for different time ranges or regions. In production, parameterized dashboards with cascading controls (country → region → site) reduce dashboard proliferation significantly.
Limit visuals per sheet. Each visual on a SPICE-backed sheet runs its own query against the SPICE dataset. A dashboard with 20 visuals runs 20 parallel queries on load. For SPICE, this is fast but adds rendering overhead. For Direct Query, 20 visuals means 20 concurrent queries to your source — a meaningful load on Redshift or Aurora at scale. Target 6–8 impactful visuals per sheet rather than data dumps.
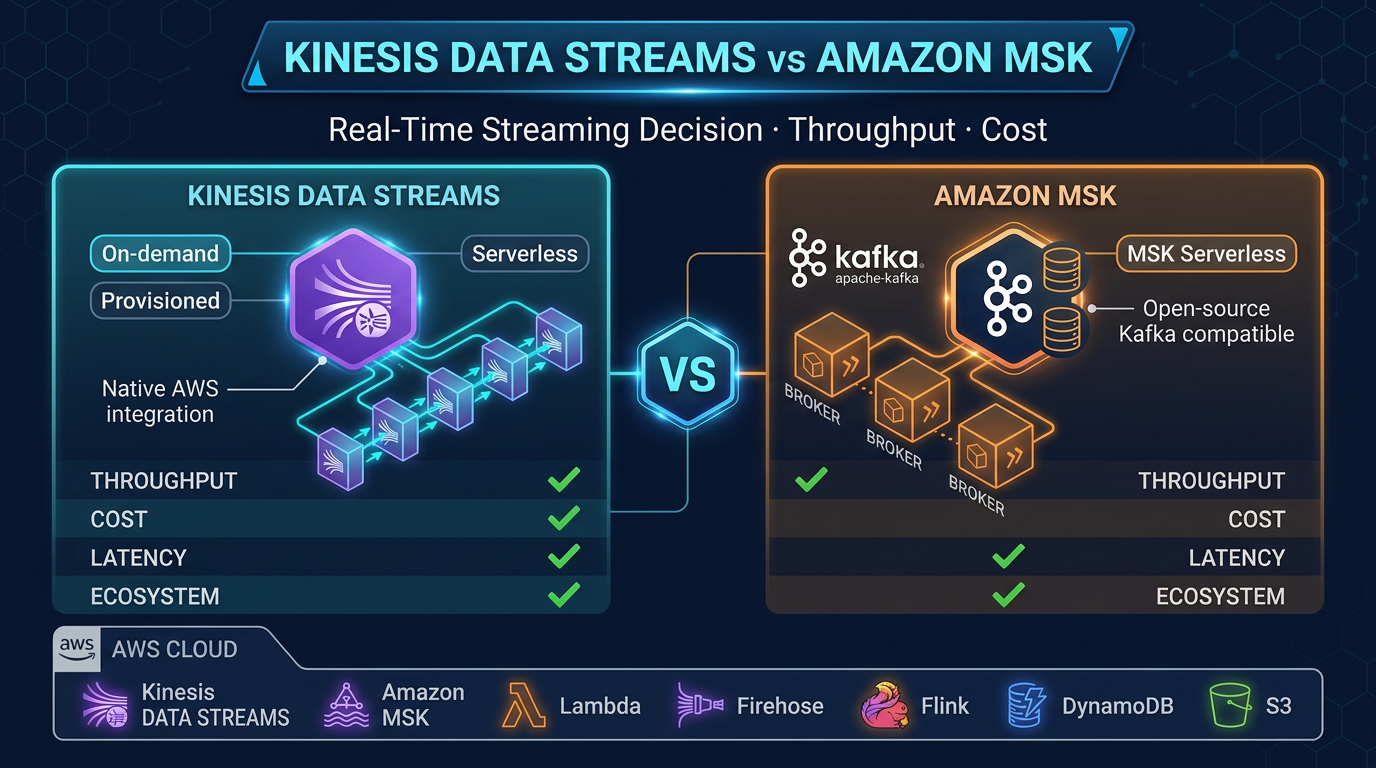
Streaming and Near Real-Time Architectures
QuickSight does not ingest streaming data directly. Near real-time patterns require a staging layer:
Kinesis → Firehose → S3 → QuickSight (SPICE, 15-min refresh). Suitable for dashboards with 15–60 minute acceptable latency. Firehose buffers stream records to S3 in Parquet or JSON format; QuickSight incremental refresh picks up new files on schedule. Cost-effective, operationally simple.
Kinesis → Lambda → Redshift → QuickSight (Direct Query). Lambda consumes from Kinesis and writes to Redshift using COPY or Redshift Data API. QuickSight Direct Query hits Redshift for near-real-time data (1–2 minute latency). Requires Redshift capacity and concurrency scaling for high dashboard load.
Kinesis → Firehose → Redshift Streaming Ingestion → QuickSight. Redshift Streaming Ingestion provides sub-second latency from Kinesis to Redshift materialized views. QuickSight Direct Query against these views gets you 5–30 second dashboard freshness. This is the most capable near-real-time pattern within QuickSight’s architecture.
For anything requiring sub-10-second latency at scale, QuickSight is not the right presentation layer. OpenSearch Dashboards or Grafana with real-time data sources serve that use case better.
Common Pitfalls at Scale
SPICE dataset sharing and permission sprawl. SPICE datasets are shareable across analyses and dashboards within an account. As datasets accumulate, tracking which datasets have RLS configured — and which don’t — becomes difficult. Implement a naming convention and tag strategy for datasets from day one. Use AWS CloudTrail to audit dataset access.
Cross-region data sources. QuickSight and your data source must be in the same region for optimal performance. Cross-region queries are supported but add latency and complicate VPC configuration. If your Redshift cluster is in us-east-1 and your QuickSight account is in us-west-2, move one of them or accept the latency trade-off.
Calculated field complexity. QuickSight calculated fields run in the visualization layer after SPICE or Direct Query results are returned. Complex nested calculations across multiple aggregation levels can produce unexpected results and are difficult to debug. Push business logic into your data model (Redshift views, dbt models, Glue jobs) and keep QuickSight calculations simple. This also makes your logic testable and auditable outside of QuickSight.
Embedding URL expiry. Embedded dashboard URLs expire in 5–10 minutes. Applications that cache embed URLs longer than their expiry produce blank dashboards for users. Implement server-side URL refresh logic triggered by your application session lifecycle, not by a fixed timer.
Amazon QuickSight is a strong choice when it fits — AWS-native integration, scalable reader pricing, and solid embedded analytics make it the default BI platform for many AWS-first organizations. But it rewards teams that understand its architecture. SPICE strategy, RLS design, and cost model optimization are not afterthoughts — they are the work.
If you are evaluating QuickSight for a new deployment or troubleshooting an existing one, the FactualMinds team works with AWS data analytics architecture daily. We are happy to review your current setup or help design a production-ready QuickSight architecture.
Related reading
- Amazon Redshift Serverless vs Provisioned: Which Is Right for Your Workload?
- Real-Time Stream Processing with Amazon Managed Service for Apache Flink
- Amazon Athena Cost Optimization: Partition Pruning, Compression, and Iceberg Tables
- AWS EMR: Serverless vs EC2 vs EKS — When to Use Each
- AWS Glue 5: Modern ETL with Apache Iceberg — Tables, Time Travel, and Lakehouse Patterns
- AWS Glue vs dbt on AWS: Data Transformation Decision Guide for 2026
- Virtual Data Modeling on AWS: Architecture, Trade-offs, and When Not to Use It
- How to Build a Serverless Data Pipeline with AWS Glue and Athena
AWS Cloud Architect & AI Expert
AWS-certified cloud architect and AI expert with deep expertise in cloud migrations, cost optimization, and generative AI on AWS.