Amazon Q in QuickSight: Building Natural-Language BI for Enterprise Data Teams
Quick summary: Half the natural-language BI demos fall apart on real schemas. A July 2026 deployment playbook for Generative BI Topics on QuickSight / Quick Sight — RLS, adoption metrics, and how this fits Amazon Quick Suite without confusing it for Q Business.
Key Takeaways
- A July 2026 deployment playbook for Generative BI Topics on QuickSight / Quick Sight — RLS, adoption metrics, and how this fits Amazon Quick Suite without confusing it for Q Business
- import { Image } from 'astro:assets'; Most enterprise BI programs solve 80% of business questions well
- The other 20% are the ad-hoc questions that arrive without warning: "Can you show me top-performing accounts in the Northeast where we increased spend last quarter but churn risk is above 40%
- Amazon Q in QuickSight (now documented as Generative BI with Quick Sight inside Amazon Quick Suite) is AWS’s answer to that 20%
- Lifecycle callout (July 2026): QuickSight / Quick Sight Generative BI is not deprecated
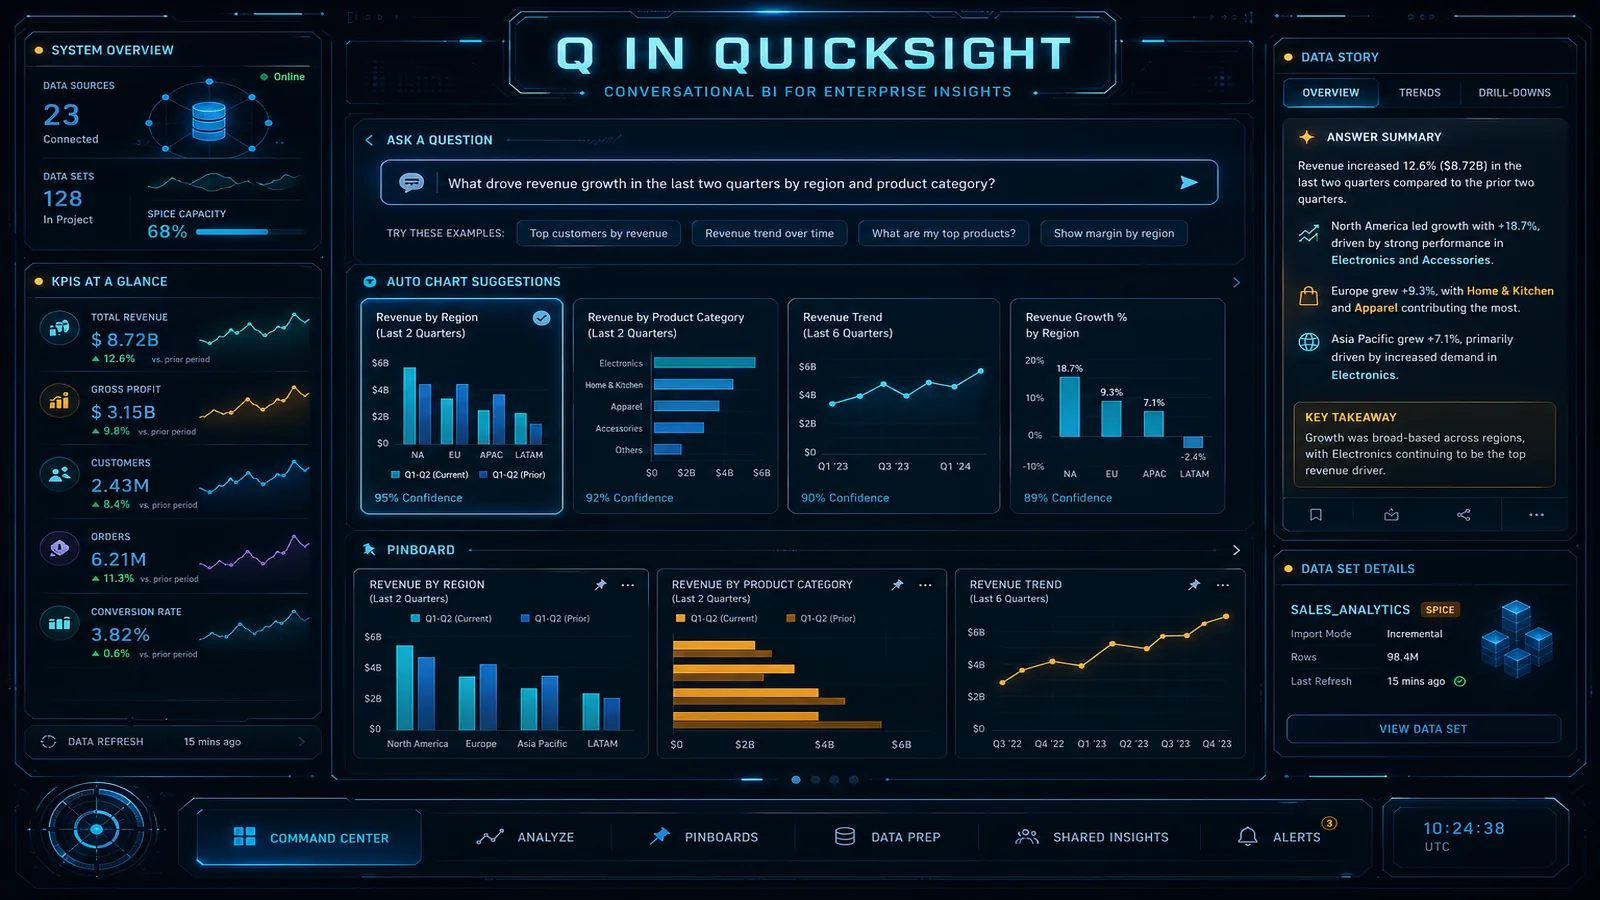
Table of Contents
Most enterprise BI programs solve 80% of business questions well. The standard dashboard covers revenue by region, pipeline by stage, support ticket volume by category — the known questions that get asked every week. The other 20% are the ad-hoc questions that arrive without warning: “Can you show me top-performing accounts in the Northeast where we increased spend last quarter but churn risk is above 40%?” That question requires either a data analyst to build a new view, or a data engineer to run a custom query. Both paths take hours to days.
Amazon Q in QuickSight (now documented as Generative BI with Quick Sight inside Amazon Quick Suite) is AWS’s answer to that 20%. Introduced at re:Invent 2023 and still the production path for natural-language BI as of July 2026, it lets business users ask questions in plain English and get visuals in seconds — without a sprint from the data team.
Lifecycle callout (July 2026): QuickSight / Quick Sight Generative BI is not deprecated. Amazon Quick Suite GA’d in October 2025 and folds Generative BI into the Quick Sight surface; existing dashboards and Topics typically upgrade in place. Separately, Amazon Q Business and Amazon Kendra enter maintenance for new customers after July 30, 2026 — that is a different product line. Full map: Amazon Quick Suite history & migration. Lineage diagram:
lineage-2026.drawio.
This post is the Topic deployment playbook (prep, RLS/CLS, adoption). It is not the Quick Suite procurement guide and not the AgentCore vs Quick TCO guide.
How Generative BI Topics Work
Three capabilities still matter under the “Q” / Generative BI branding:
Topics are the core. A Topic is a QuickSight dataset enriched with business-friendly metadata: display names, synonyms, glossary terms, named entities, and relationships. Natural-language questions map to Topic fields and return visuals. Topics bound the universe of answers — Q does not invent arbitrary warehouse SQL. That limit is also the security property.
Generative Q&A / Stories adds LLM-written narratives and multi-visual exploration. Ask “why did revenue decline in March?” and you get visuals plus interpretation. Narrative/Stories features are where generative metering can apply — confirm current pricing before wide rollout.
AI-assisted authoring / data prep helps analysts build calculations, refine visuals, and clean datasets with natural language. Useful when onboarding a new subject area; it does not replace Topic curation.
Enterprise edition (or an equivalent Quick Suite seat that includes Quick Sight Generative BI) is required. Expanding coverage means expanding Topics — not hoping the model sees your whole lake.
Dataset Preparation: Making a Dataset Q-Ready
The single biggest determinant of Q adoption quality is how well you prepare the underlying dataset as a Q Topic. A raw data warehouse table with abbreviated column names and no business context will produce poor Q results even if the data is correct.
Field naming
Replace technical column names with full business names in the Topic configuration. Q maps user vocabulary to field names:
| Column (raw) | Q Topic display name | Why it matters |
|---|---|---|
tot_rev_usd | Total Revenue (USD) | Users say “revenue”, not “tot_rev” |
cust_acq_dt | Customer Acquisition Date | Date context needed for time-based questions |
rgn_cd | Region | “region” is a natural word; “rgn_cd” is not |
churn_risk_scr | Churn Risk Score | Score implies numeric; Q will treat it as a measure |
prod_sku_id | Product SKU | Clarifies this is a categorical identifier |
Synonyms
Add synonyms for every business term that has multiple natural-language representations. This is where most Q Topic configurations are under-invested:
"revenue" → synonyms: sales, income, bookings, ARR, top-line
"customer" → synonyms: account, client, company, org
"churn" → synonyms: cancellation, attrition, lost customer, churned
"quarter" → synonyms: Q1, Q2, Q3, Q4 (map to date filter logic)
Synonyms are configured in the Q Topic editor. There is no programmatic bulk import — you enter them in the console, but the time investment pays off in Q accuracy.
Field types and measures vs. dimensions
Q needs to know which fields are measures (aggregatable numbers: revenue, count, score) and which are dimensions (categorical groupings: region, product, customer segment). QuickSight auto-detects based on data type, but you should review and correct these manually — a ZIP code might be detected as a numeric measure when it should be a dimension.
Relationship definitions
For Topics built from multiple datasets (a star schema with fact and dimension tables), define the relationships explicitly in the Topic:
orders.customer_id → customers.customer_id (many-to-one)
orders.product_id → products.product_id (many-to-one)
orders.region_code → regions.region_code (many-to-one)
Without relationship definitions, Q cannot answer questions that span multiple tables (e.g., “revenue by product category” where category lives in the products dimension table).
Dataset Q-readiness checklist:
- All column names replaced with full business names
- Synonyms added for top 20 most-searched business terms
- All measures/dimensions correctly classified
- Date fields formatted correctly (YYYY-MM-DD) and marked as date type
- Categorical fields with > 50,000 unique values excluded from Topic (cardinality limit)
- Relationships between tables defined if using multiple datasets
- Glossary terms from the business glossary linked to relevant fields
- Test 10 sample questions that real users would ask — review accuracy before launch
Row-Level and Column-Level Security with Generative BI
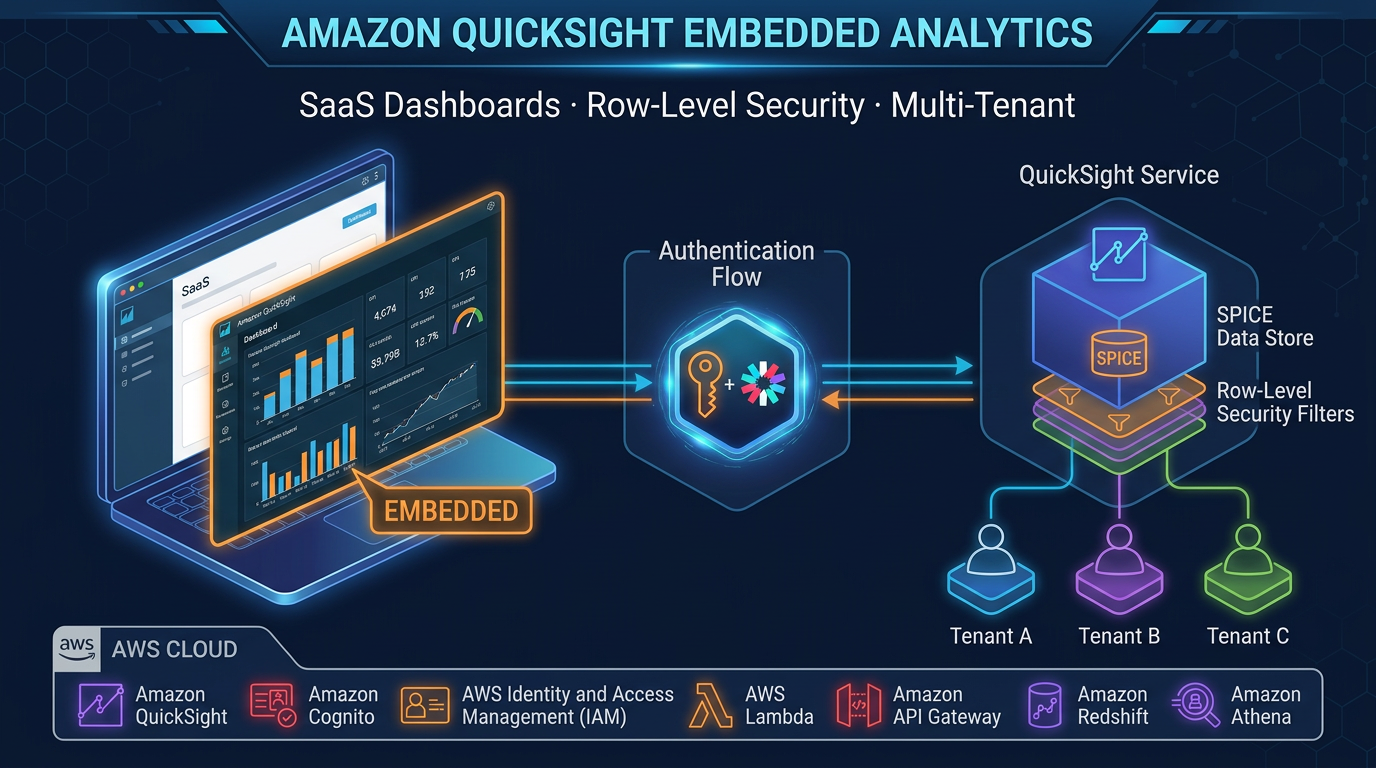
Q in QuickSight inherits the security configuration of the underlying QuickSight dataset. This is the security property you need to verify before rolling out Q to multi-tenant environments or datasets containing sensitive information.
Row-level security (RLS)
Configure RLS rules on the QuickSight dataset that backs the Q Topic. When RLS is active, Q Topic queries automatically apply the RLS filter for the authenticated user:
import boto3

quicksight = boto3.client('quicksight', region_name='us-east-1')

# Create an RLS rule using a rules dataset that maps user emails to data segments
quicksight.create_data_set(
    AwsAccountId='123456789012',
    DataSetId='customer-rls-rules',
    Name='Customer RLS Rules',
    ImportMode='SPICE',
    PhysicalTableMap={
        'rls-source': {
            'S3Source': {
                'DataSourceArn': 'arn:aws:quicksight:us-east-1:123456789012:datasource/s3-source',
                'InputColumns': [
                    {'Name': 'UserName', 'Type': 'STRING'},
                    {'Name': 'region_code', 'Type': 'STRING'}  # Filter field matching dataset
                ],
                'UploadSettings': {'Format': 'CSV', 'ContainsHeader': True}
            }
        }
    }
)

# Apply RLS to the main dataset
quicksight.create_row_level_permission_data_set(
    AwsAccountId='123456789012',
    DataSetId='sales-analytics-main',  # The dataset registered as a Q Topic
    DataSetArn='arn:aws:quicksight:us-east-1:123456789012:dataset/customer-rls-rules',
    PermissionPolicy='GRANT_ACCESS',
    FormatVersion='VERSION_2'
)
Once RLS is applied, a regional sales manager asking Q “show me revenue by product” will see only revenue for their region — even though Q is querying the full dataset. Verify this works by testing Q queries as a restricted user before rolling out to business users. RLS failures (where a restricted user sees data they should not) are hard to detect post-rollout.
Column-level security
For datasets with sensitive columns (compensation data, SSNs, customer PII), use QuickSight column-level permissions to exclude specific fields from Q Topics:
# Exclude sensitive columns from the dataset used in Q Topics
quicksight.update_data_set(
    AwsAccountId='123456789012',
    DataSetId='hr-analytics-dataset',
    Name='HR Analytics',
    ImportMode='SPICE',
    ColumnLevelPermissionRules=[
        {
            'Principals': ['arn:aws:quicksight:us-east-1:123456789012:group/default/hr-executives'],
            'ColumnNames': ['base_salary', 'bonus_target', 'ssn_hash', 'performance_rating']
        }
    ],
    # ... rest of dataset config
)
Columns not included in the column-level permission rules for the Q-querying user group will not appear in Q responses — Q will not surface salary data in an answer about headcount trends if the authenticated user does not have column-level access to the salary field.
CloudTrail audit for Q queries
Every Q Topic query generates a CloudTrail event (quicksight:GenerateEmbedUrlForRegisteredUser for embedded Q, quicksight:SearchAnswers for console Q). This is your audit trail:
import boto3
from datetime import datetime, timedelta

cloudtrail = boto3.client('cloudtrail', region_name='us-east-1')

# Pull Q query events from the last 7 days
response = cloudtrail.lookup_events(
    LookupAttributes=[
        {'AttributeKey': 'EventName', 'AttributeValue': 'SearchAnswers'}
    ],
    StartTime=datetime.now() - timedelta(days=7),
    EndTime=datetime.now()
)

for event in response['Events']:
    detail = json.loads(event['CloudTrailEvent'])
    print(f"User: {detail.get('userIdentity', {}).get('arn', 'unknown')}")
    print(f"Time: {event['EventTime']}")
    print(f"Topic: {detail.get('requestParameters', {}).get('topicId', 'unknown')}")
Preserve these logs in S3 via CloudTrail’s S3 delivery configuration for long-term compliance archiving.
Measuring Q Adoption
The most common mistake in enterprise Q deployments is treating rollout as the finish line. Q is a product that improves with curation — unanswered questions tell you where to invest Topic enrichment effort.
Unanswered question analysis
QuickSight Q tracks questions that did not produce a result. These are accessible via the QuickSight API:
quicksight = boto3.client('quicksight')

# Pull unanswered questions for a Topic (past 30 days)
response = quicksight.list_topic_reviewed_answers(
    AwsAccountId='123456789012',
    TopicId='sales-analytics-topic'
)

# Also pull directly from the Q feedback API
feedback_response = quicksight.describe_topic_permissions(
    AwsAccountId='123456789012',
    TopicId='sales-analytics-topic'
)

# For production: query the Q usage events from CloudWatch Logs Insights
# QuickSight publishes Q query metrics to CloudWatch when configured
Run an unanswered question review weekly during the first 90 days. Each cluster of failed questions points to a missing synonym, a missing relationship definition, or a field that should be added to the Topic. After 90 days, the Topic’s coverage stabilizes and review frequency can drop to monthly.
User satisfaction scoring
Q responses include thumbs up/down feedback buttons. Track these via CloudWatch metrics (QuickSight publishes Q feedback events to CloudWatch when the account-level CloudWatch logging is enabled):
| Metric | Target (90-day) | Action if below target |
|---|---|---|
| Q answer rate | > 80% of questions produce a result | Review unanswered questions weekly |
| Thumbs-up rate | > 70% of rated answers | Review thumbs-down questions for Topic gaps |
| Unique Q users / total users | > 40% within 60 days | Train users; embed Q in primary dashboard |
| Questions per Q user per week | > 5 | Indicates genuine adoption vs. one-time trial |
Monthly adoption report setup
Create a QuickSight dashboard that tracks Q adoption metrics by pulling from CloudWatch:
- Enable QuickSight CloudWatch logging at the account level (AWS console → QuickSight → Admin → CloudWatch integration)
- Create a CloudWatch Logs Insights query that extracts Q query events, answer rates, and user counts
- Connect CloudWatch Logs as a QuickSight data source
- Build an internal “Q Adoption” dashboard visible to the BI team and data owners
This creates a feedback loop: the data team can see which Topics are heavily used (worth additional curation) and which are underused (worth training or deprecation).
Q in QuickSight vs. Building a Custom RAG BI Tool
When enterprise teams first encounter Q in QuickSight’s Topic-based scope limitation, the reaction is often “let’s just build our own generative BI tool with an LLM and a vector database.” This is worth evaluating honestly.
| Dimension | Q in QuickSight | Custom RAG BI Tool |
|---|---|---|
| Time to first user value | 1–2 weeks (Topic setup + testing) | 3–6 months (architecture, engineering, testing) |
| ML engineering required | None | Yes — prompt engineering, RAG pipeline, eval |
| Infrastructure to manage | None (QuickSight-managed) | Vector DB (OpenSearch/pgvector), Lambda/ECS, API Gateway |
| Response quality | Good for well-curated Topics | Depends heavily on prompt engineering quality |
| Response control | Limited — QuickSight controls LLM prompts | Full — you control the prompt, model, retrieval |
| Security integration | Native RLS/CLS from QuickSight datasets | Custom implementation required |
| Audit trail | CloudTrail automatically | Custom logging implementation required |
| Ongoing maintenance | Topic curation only | Model upgrades, prompt updates, vector DB maintenance |
| Multi-source querying | Topics only | Possible — can query multiple data sources |
| Cost (Year 1, 100 users) | ~$13,000–$22,000 (Enterprise license) | ~$80,000–$150,000 (engineering + infra) |
Choose Q in QuickSight when:
- Your data assets are already in QuickSight datasets (or can be)
- Business users are the primary audience (not developers querying programmatically)
- Time-to-value in weeks matters more than full control over responses
- Your security model is row/column-based (well-supported natively)
Choose a custom RAG BI tool when:
- You need to query data sources that cannot be loaded into QuickSight (operational DBs, real-time streams)
- Your use case requires multi-step reasoning across multiple data sources in one answer
- You want to embed the BI experience in a product with heavy custom branding
- Your organization already has the ML engineering capacity to build and maintain it
For most enterprises without a dedicated ML platform team, Generative BI Topics deliver most of the natural-language BI value without standing up a RAG platform. Build custom only when Topics cannot reach the data or you need product-embedded multi-step agents — and then evaluate Bedrock AgentCore separately from Quick Suite seats.
When this advice fails
- You need workforce chat over SharePoint/Confluence with actions — that is Quick Suite / (legacy) Q Business territory, not Topics alone. Start with the Quick Suite history guide.
- Customer-facing high-volume Q&A — do not buy Quick seats for external chat; use AgentCore or your app stack.
- Datasets cannot land in QuickSight (operational DBs, streams) — Topics will not magically reach them.
What to do Monday morning
- Pick one high-friction subject area already in QuickSight; create a Topic with business names + top-20 synonyms.
- Prove RLS: ask the same question as a restricted user and a full-access user before any broad share.
- Seed 10 golden questions; fix unanswered ones before inviting a pilot cohort.
- Turn on usage/unanswered-question review for 90 days; kill Topics nobody asks about.
- Align procurement language: Generative BI Topics ≠ Q Business ≠ AgentCore — attach the lineage matrix to the RFP.
Need help with Topic setup, RLS, or Quick Suite vs QuickSight positioning? FactualMinds works with enterprise BI teams on QuickSight / Quick Sight architecture and generative analytics buy-vs-build decisions.
AWS Cloud Architect & AI Expert
AWS-certified cloud architect and AI expert with deep expertise in cloud migrations, cost optimization, and generative AI on AWS.