AWS Observability: Monitoring vs Alerting — Stop Paging on Green Dashboards
Quick summary: Monitoring is visibility; alerting is interruption. Teams with 40+ CloudWatch alarms and an actionable page rate under 50% are monitoring loudly and alerting poorly — fix ownership, SLO burn, and canaries before adding another metric.
Key Takeaways
- Teams with 40+ CloudWatch alarms and an actionable page rate under 50% are monitoring loudly and alerting poorly — fix ownership, SLO burn, and canaries before adding another metric
- On July 22, 2026, the observability problem we still see most often is not “missing CloudWatch
- For stack tiers (Application Signals vs AMP/AMG), see observability beyond CloudWatch
- Inventory alarms, compute actionable page rate for the last 30 days, and mark each Keep / Retune / Delete
- Stop adding alarms until actionable rate ≥ 70%
Table of Contents
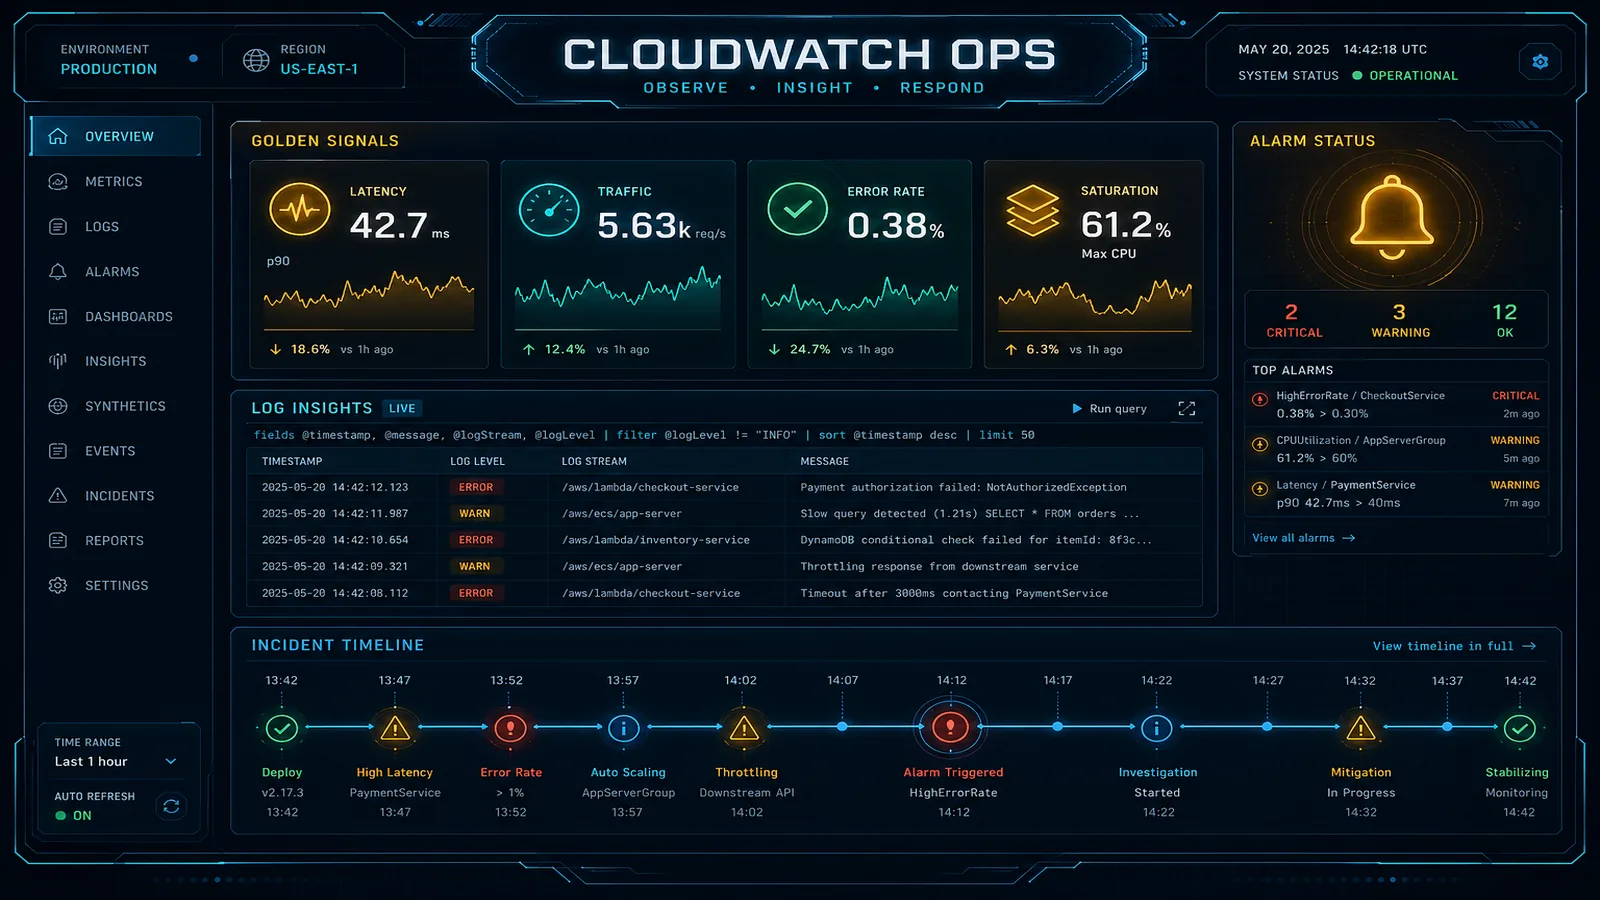
On July 22, 2026, the observability problem we still see most often is not “missing CloudWatch.” It is confusing monitoring with alerting. Teams ship forty metric alarms, route them all to Slack or a pager, and wonder why nobody trusts the noise — while Application Signals SLOs and Synthetics canaries that would catch user impact sit unused.
Monitoring answers “what is happening?” Alerting answers “who must act now?” Mixing them produces green dashboards that nobody watches and red pages that nobody believes.
This post is the decision framework and a first-party checklist. For alarm mechanics and Logs Insights hygiene, see CloudWatch best practices. For stack tiers (Application Signals vs AMP/AMG), see observability beyond CloudWatch. For SLA math, see customer-facing SLA / SLO design.
Monitoring Is Visibility; Alerting Is Interruption
| Monitoring | Alerting | |
|---|---|---|
| Purpose | Observe and investigate | Interrupt a human |
| Typical AWS tools | Metrics, Logs Insights, dashboards, Application Signals map, Service Events | Alarms → SNS → PagerDuty/Opsgenie; SLO burn alerts |
| Success metric | Time to understand | Actionable page rate |
| Failure mode | Blind spots | Fatigue and ignored pages |
Opinionated take: Prefer fewer than ten production pages per product, backed by deep monitoring. Expand monitoring freely; expand paging only when actionable rate stays high.
First-Party Noise Budget
We use a simple 30-day worksheet — no client silhouette required:
| Input | Example worksheet |
|---|---|
| Production pages | 40 |
| Pages that produced a fix or config change | 12 |
| Actionable rate | 30% |
| Target | ≥ 70% |
At 30% actionable, the correct move is delete / retune / composite, not “add Datadog.” Fill the monitoring vs alerting checklist for every production alarm.
Reproduce this — Open the checklist. Inventory alarms, compute actionable page rate for the last 30 days, and mark each Keep / Retune / Delete. Stop adding alarms until actionable rate ≥ 70%.
What Should Page in 2026
- User-journey failures — CloudWatch Synthetics canaries on login, checkout, or critical API paths.
- SLO burn — Application Signals SLOs on latency and availability for those same journeys (enable Transaction Search).
- Capacity cliffs — RDS free storage, certificate expiry, ALB 5xx surge that precedes SLO burn.
Everything else is monitoring: Container Insights graphs, Service Events after deploys (announced July 6, 2026), Logs Insights saved queries, dashboards.
What broke — A platform team paged on ECS CPU > 70% for every service. After a Black Friday traffic shape change, the pager fired 60+ times in a weekend; three pages were user-visible (checkout 5xx). Actionable rate collapsed. Fix: delete CPU pages, add one Synthetics checkout canary + Application Signals SLO burn, keep a single ALB 5xx composite. Weekend pages dropped to low single digits with higher actionable rate.
Composite Alarms and Ownership
- One incident should produce one page. Use CloudWatch composite alarms so related metric alarms do not fan out.
- Every page needs an owner and a runbook URL in the alarm description.
- Route to Slack-only only for non-urgent monitoring; do not pretend Slack is a pager.
Instrumentation Side Constraint
Alerting quality depends on instrumentation quality. Net-new tracing should use ADOT / Application Signals, not the X-Ray SDKs (maintenance mode since February 25, 2026). Bad traces produce bad SLOs; bad SLOs produce bad pages.
What to Do This Week
- Export CloudWatch alarms for production; paste into the checklist.
- Compute actionable page rate for the last 30 days.
- Delete or mute any alarm with repeated fire and zero action.
- Ensure ≤ 3 critical journeys have Synthetics + Application Signals SLOs.
- If you need 24/7 human response behind the thin alert set, see 24/7 managed monitoring or contact us / managed services.
What This Post Doesn’t Cover
- Synthetics runtime and VPC networking deep dive (separate guide).
- RUM / Core Web Vitals (separate guide).
- AMP/AMG cost modeling (beyond-cloudwatch + AMG post).
- Full Logs Insights query library (see examples/observability/logs-insights-queries.txt).
AWS Cloud Architect & AI Expert
AWS-certified cloud architect and AI expert with deep expertise in cloud migrations, cost optimization, and generative AI on AWS.