Log Aggregation and Intelligent Sampling with CloudWatch and OpenTelemetry
Ingesting every debug log to CloudWatch is how observability becomes a FinOps incident. Tail sampling with ADOT, Logs Insights, and Firehose to S3 for the long tail.

Ingesting every debug log to CloudWatch is how observability becomes a FinOps incident. Tail sampling with ADOT, Logs Insights, and Firehose to S3 for the long tail.

The reflex to bolt Amazon Managed Prometheus + Grafana onto every workload is how observability bills quietly double. CloudWatch Application Signals now gives you an auto-discovered service map, SLOs, and traces with near-zero setup; AMP only earns its keep when you are PromQL-native or drowning in high-cardinality metrics — where ingestion (not retention) is the cost driver. Here is the decision matrix, an ADOT dual-export config, and the three levers that actually cut the AMP bill.

CloudWatch Logs Insights bills $0.005 per GB scanned and high-cardinality custom metrics multiply costs. Cardinality budgets, sampling rules, and FinOps fixes.

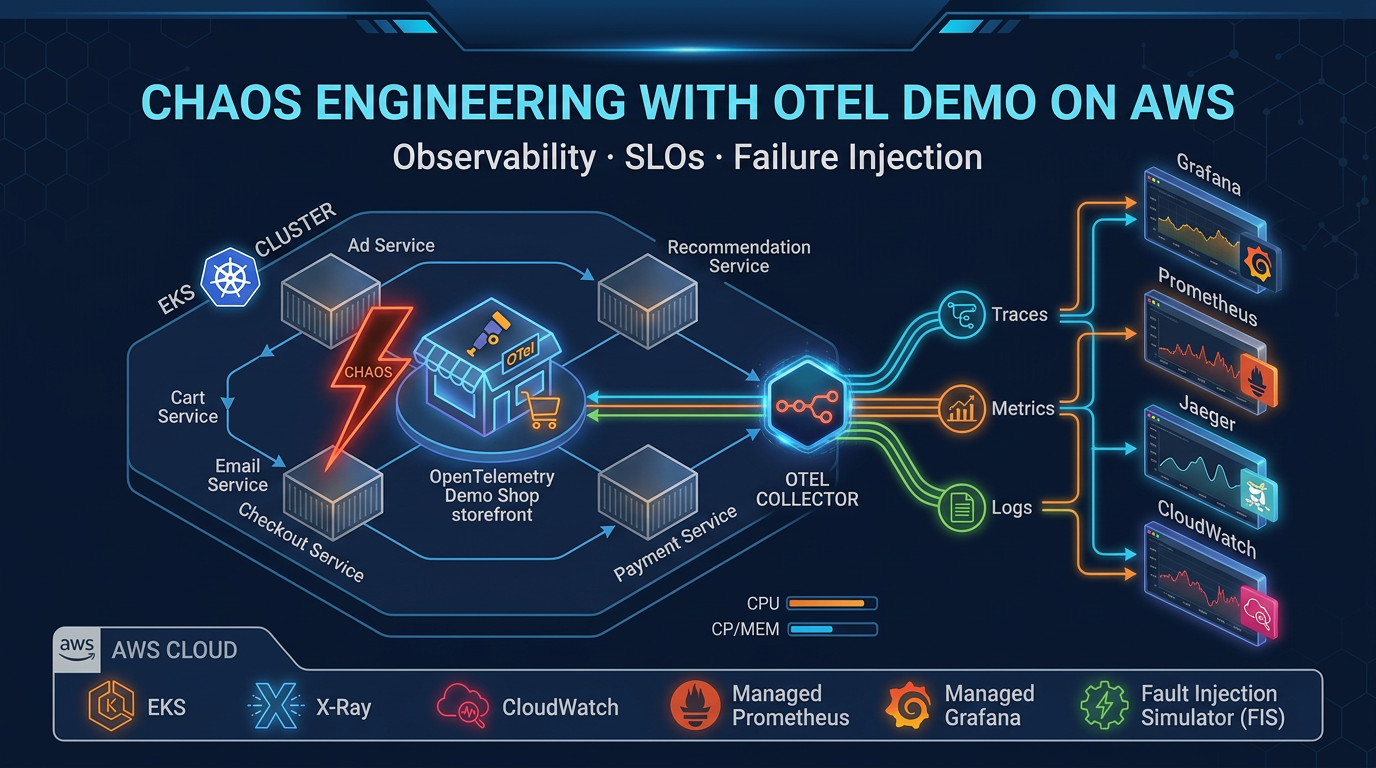
The AWS observability team built a chaos engineering game on top of the official OTel Demo. 44 injected failures. Three signals. One LLM judge. Here's everything inside it.

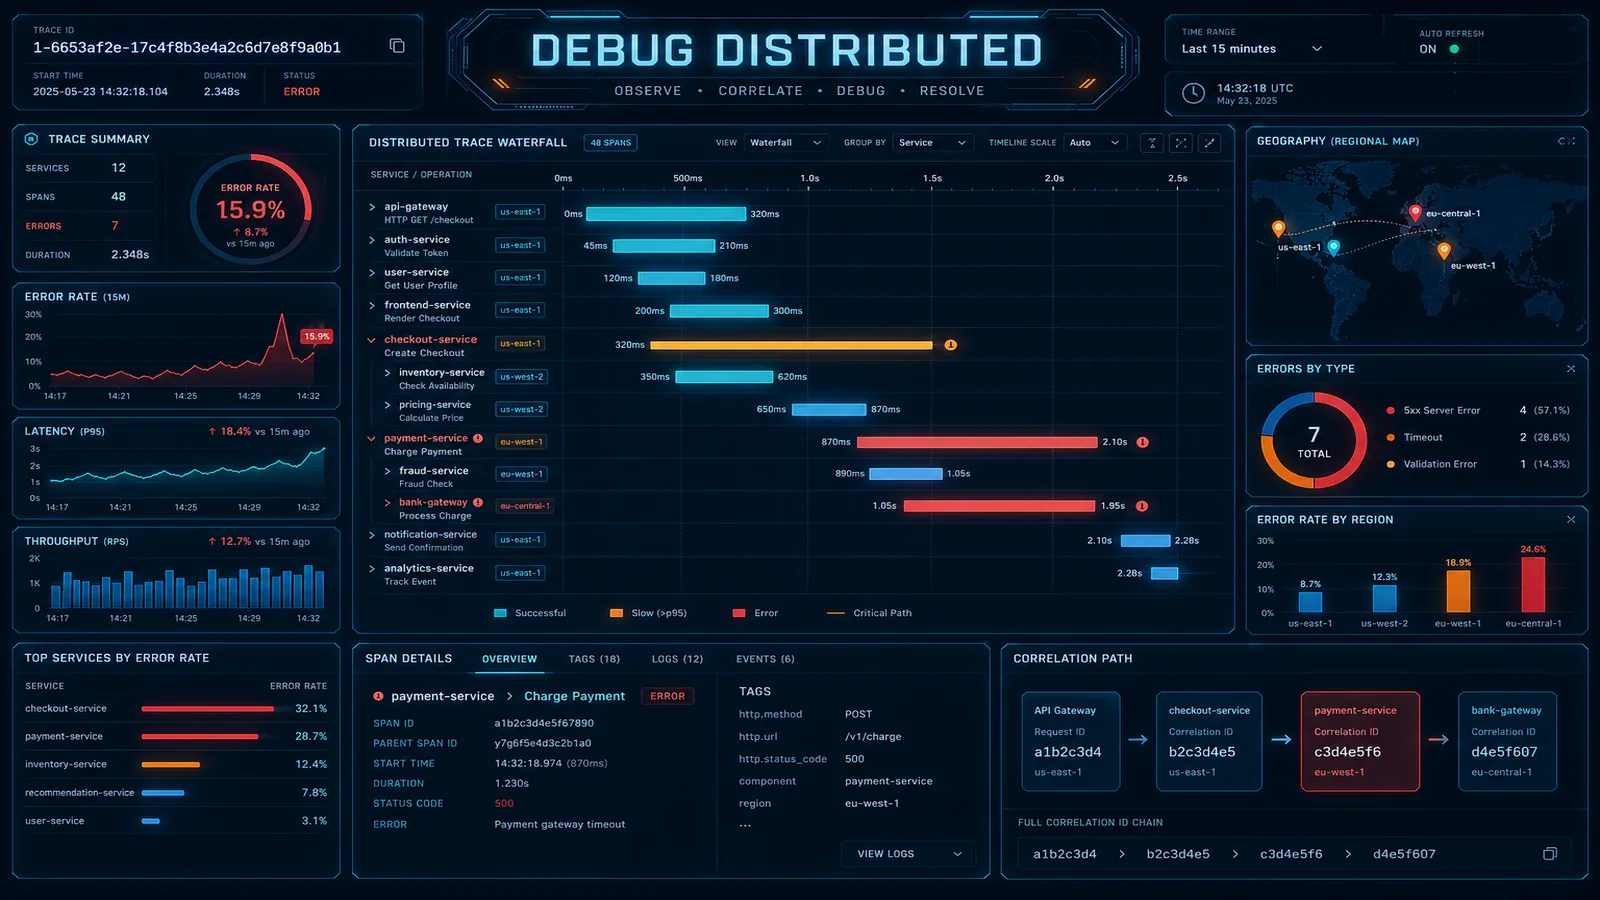
A 500ms latency spike in a distributed system could be a slow RDS query, a Lambda cold start, a downstream API timeout, or a CloudWatch Logs ingestion delay. Finding the cause requires correlated logs, traces, and metrics — not grep.
We use cookies and similar technologies to analyze site traffic, personalize content, and provide social media features. By clicking “Accept,” you consent to our use of cookies. You can adjust your preferences at any time.