AWS IoT TwinMaker: Digital Twin Architecture for Manufacturing
Quick summary: AWS IoT TwinMaker connects real-time sensor data, 3D models, and operational history into a living digital twin of your facility. Here is how manufacturers use it for remote monitoring, anomaly investigation, and connected worker applications.
Key Takeaways
- AWS IoT TwinMaker connects real-time sensor data, 3D models, and operational history into a living digital twin of your facility
- A dashboard full of line charts can tell you that Hydraulic Press #7 on Line 3 is running hot
- AWS IoT TwinMaker is the AWS service purpose-built for manufacturing digital twins
- Three elements distinguish a genuine digital twin from a static 3D model or a time-series dashboard: Synchronization
- A 3D model that was accurate when built but never updated is not a digital twin — it is a CAD file
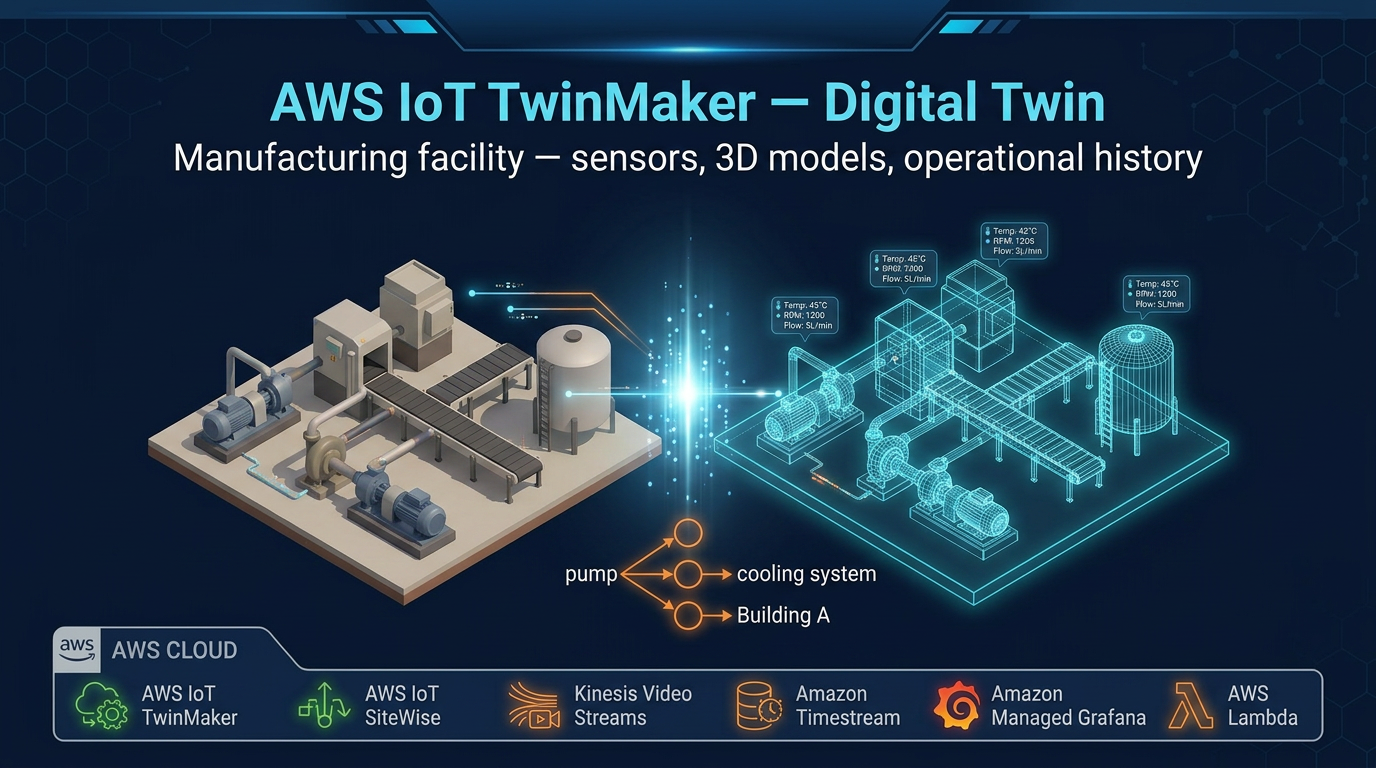
Table of Contents
A dashboard full of line charts can tell you that Hydraulic Press #7 on Line 3 is running hot. What it cannot tell you is whether the heat is coming from the drive motor or the coolant circuit — or where exactly Press #7 sits relative to the maintenance entrance, the nearest emergency shutoff, and the three other presses downstream that share its coolant loop.
That is the gap a digital twin fills. Not just data visualization, but spatial and relational context: a virtual counterpart to every physical asset in your facility, connected to live sensor streams, camera feeds, and maintenance history, and explorable by anyone on your operations or maintenance team — including engineers sitting in an office 2,000 miles from the factory floor.
AWS IoT TwinMaker is the AWS service purpose-built for manufacturing digital twins. This post covers how it works, how to build one, and where it delivers the most operational value.
What Is a Digital Twin?
The term “digital twin” has been overloaded by vendors. For clarity: a digital twin is a virtual representation of a physical asset or system that is continuously synchronized with real-world data.
Three elements distinguish a genuine digital twin from a static 3D model or a time-series dashboard:
Synchronization. The twin updates in real time (or near real time) as the physical asset changes. A 3D model that was accurate when built but never updated is not a digital twin — it is a CAD file.
Relational context. The twin knows the relationships between assets. Hydraulic Press #7 is part of Production Line 3. Line 3 is in Building A. Building A’s coolant loop feeds Presses 5, 6, and 7. These relationships let you trace the impact of a single failure across connected systems.
Multiple data sources. Sensor telemetry alone is not a digital twin. A useful twin integrates live measurements with video feeds, maintenance history, equipment specifications, and operational records — giving engineers a complete picture in one interface.
AWS IoT TwinMaker provides the infrastructure to build and maintain all three elements for manufacturing facilities of any scale.
AWS IoT TwinMaker Architecture
The Knowledge Graph: Entities, Components, and Relationships
The foundation of every TwinMaker deployment is the knowledge graph — a structured representation of your physical facility as entities connected by relationships.
Entities represent physical things: a hydraulic press, a production line, a building, a coolant pump. Each entity has a unique ID and a set of properties. Properties can be static (equipment model number, installation date) or dynamic (live temperature reading, current anomaly score).
Components attach data sources and behavior to entities. A SiteWise component connects an entity’s properties to an AWS IoT SiteWise asset. A video component links to a Kinesis Video Streams camera feed. A maintenance component connects to a Lambda function that queries your CMMS (Computerized Maintenance Management System) for open work orders on this equipment. Each entity can have multiple components — a hydraulic press entity might have a SiteWise component for sensor data, a video component for the drive motor camera, and a maintenance component for work order status.
Relationships define how entities connect: containedIn (Press #7 is in Line 3), feeds (the coolant pump feeds Press #7), isPartOf (the drive motor is part of Press #7). These relationships enable graph traversal — when an engineer investigates Press #7, TwinMaker can surface related entities (upstream coolant pump, downstream conveyor) in the same view.
A typical factory knowledge graph hierarchy looks like this:
Factory (entity)
  └── Building A (entity)
        └── Production Line 3 (entity)
              ├── Hydraulic Press #5 (entity)
              │     ├── SiteWise Component → SiteWise Asset: Press_5
              │     ├── Video Component → Kinesis Stream: press5-drive-motor
              │     └── Maintenance Component → Lambda: cmms-query
              ├── Hydraulic Press #6 (entity)
              └── Hydraulic Press #7 (entity)
This hierarchy is queryable. The operations center dashboard can request: “show all equipment in Building A with anomaly score above 0.8” — TwinMaker traverses the graph and returns the matching entities with their current property values.
Data Sources: Connectors
TwinMaker does not store your operational data — it connects to the systems that already hold it. Connectors define how TwinMaker reads property values from external sources.
AWS IoT SiteWise connector. The most commonly used connector in manufacturing. Maps TwinMaker entity properties to SiteWise asset properties. When a dashboard or API queries the current temperature of Press #7, TwinMaker passes the request through the SiteWise connector, which reads from the SiteWise asset property. SiteWise’s anomaly detection scores are also surfaced this way — the anomaly score becomes a TwinMaker entity property that can drive visual states in the 3D scene.
Amazon Timestream connector. For high-frequency time-series data that you store directly in Timestream rather than SiteWise. Useful for sensors sampled at 100ms intervals where SiteWise’s data model is not appropriate.
Kinesis Video Streams connector. Attaches camera feeds to TwinMaker entities. The Grafana plugin can render a live video panel alongside sensor time-series panels — so when an engineer investigates a vibration alert, they can see the live drive motor camera without leaving the dashboard.
Lambda connector. The escape hatch for any data source not covered by the pre-built connectors. Your Lambda function receives a TwinMaker property request, queries your source system (ERP, CMMS, MES, custom historian), and returns the value. Use this for: SAP maintenance records, custom historian data, work order status, spare parts inventory.
Scene Composer: Building the 3D Scene
The knowledge graph defines relationships and data. Scene Composer adds spatial context — a 3D environment where entities are placed in their real-world locations.
Scene Composer is a web-based editor inside the AWS console. You upload 3D models of your equipment in GLTF format (most CAD tools export to GLTF) and place them in the scene. The scene can also import point cloud scans from 3D capture tools — for facilities where you want photorealistic spatial accuracy rather than schematic layouts.
Each 3D object in the scene is linked to a TwinMaker entity. When you click a press in the 3D scene, Grafana opens the data panels for that entity — sensor history, video feed, maintenance log.
Scene Composer supports conditional color states: define rules that change the color of a 3D model based on entity property values. A common pattern:
- Green: anomaly score < 0.5 (normal operation)
- Yellow: anomaly score 0.5–0.8 (elevated, monitor)
- Red: anomaly score > 0.8 (investigate immediately)
This gives the operations center a single-glance facility overview — a red machine in the 3D scene immediately draws attention, and a click opens the detailed investigation view.
Amazon Managed Grafana: The Dashboard Layer
TwinMaker integrates natively with Amazon Managed Grafana via the TwinMaker Grafana plugin. This is the recommended visualization platform as of 2026. Note that AWS IoT SiteWise Monitor entered maintenance mode in November 2025 — it no longer receives new features. For all new TwinMaker deployments, use Amazon Managed Grafana.
The TwinMaker Grafana plugin enables:
- 3D scene panels: render the TwinMaker 3D scene with live data overlays inside a Grafana dashboard
- Entity history panels: time-series charts of any TwinMaker entity property (reads through connectors to the underlying data source)
- Video panels: live Kinesis Video Streams playback embedded in the dashboard
- Alarm panels: TwinMaker entity alarm states, linked to the 3D scene
Mixed dashboards combine all of these: a 3D factory overview on the left, time-series charts for selected equipment on the right, live video in the bottom panel. The 3D scene is interactive — clicking a piece of equipment filters the adjacent data panels to that equipment.
Building a Manufacturing Digital Twin: Step by Step
Step 1: Define Your Entity Schema
Before importing any data, design the entity types and component types that will represent your facility.
Entity types define what categories of physical things exist in your facility: Equipment, ProductionLine, Building, SubSystem. These are schemas — each entity type defines what properties an entity of that type can have.
Component types define reusable data connection patterns. Create a SiteWiseComponent type that maps equipment properties (temperature, pressure, vibration, anomaly_score) to SiteWise asset properties using the SiteWise connector. Create a VideoComponent type with a camera stream URL property using the Kinesis Video Streams connector. Create a MaintenanceComponent type with last_work_order, open_work_orders, and last_pm_date properties using a Lambda connector.
Good schema design upfront pays dividends: when you add the 50th press to your facility, it uses the same component types as the first 49, and the 3D scene conditional states and Grafana dashboards work without modification.
Step 2: Import Assets from AWS IoT SiteWise
Most manufacturing facilities deploying TwinMaker already have SiteWise assets set up for their equipment. TwinMaker’s SiteWise connector can import this hierarchy directly — creating TwinMaker entities that mirror your SiteWise asset tree.
The import creates one TwinMaker entity per SiteWise asset. For each entity, it attaches a SiteWise component that maps all SiteWise asset properties (temperature, pressure, OEE, anomaly_score) to TwinMaker entity properties. After import, your TwinMaker workspace has a complete entity hierarchy that reflects your SiteWise asset model — with all live sensor data accessible through TwinMaker’s query interface.
For equipment not yet in SiteWise, you can create TwinMaker entities manually and attach Lambda connectors to pull data from your historian or SCADA system while you complete a SiteWise migration in parallel.
Step 3: Build the 3D Scene
Export GLTF models from your CAD system for each equipment type. If you have a BIM (Building Information Model) of your facility, many BIM tools export GLTF or can convert through intermediary formats.
Upload the GLTF files to an S3 bucket. In Scene Composer, create a new scene and import the environment model (factory floor layout). Place equipment models at their real-world positions — Scene Composer supports coordinate systems and scaling so you can use actual facility dimensions.
For each 3D object, link it to the corresponding TwinMaker entity. Configure conditional color states on each equipment model. Add tags — clickable overlays in the 3D scene that display current property values on hover (e.g., a temperature gauge overlay that shows the current reading without requiring a click).
Add camera positions: define overhead views (for the operations center summary view) and close-up views (for equipment detail investigation).
Step 4: Connect Video Feeds
Create a Kinesis Video Stream for each camera in your facility. Industrial cameras connect to Kinesis Video Streams via the Kinesis Video Streams SDK or a hardware encoder with RTSP output (using the Kinesis Video Streams WebRTC ingestion for low-latency feeds).
Attach Video components to the relevant TwinMaker entities. Map each entity’s camera property to the corresponding Kinesis Video Stream ARN. The TwinMaker Grafana plugin can then render live video in a panel alongside sensor data.
Key camera positions for manufacturing digital twins:
- Drive motor and main bearing access points (shows vibration-related visual cues)
- Coolant reservoir (level, color, condition)
- Material entry/exit points (product quality visual inspection)
- Electrical cabinet (for thermal events)
Step 5: Configure the Grafana Dashboard
In Amazon Managed Grafana, install the TwinMaker plugin. Create a data source connection to your TwinMaker workspace.
Build the operations center dashboard:
- 3D overview panel (full-width, top): TwinMaker scene panel showing the factory floor with conditional color states active. Auto-refreshes every 30 seconds.
- Equipment detail panel (sidebar): appears when an entity is selected in the 3D scene. Shows last 4 hours of sensor history for selected equipment.
- Active alerts panel (bottom left): list of entities with anomaly score > 0.5, sorted by score descending.
- Video panel (bottom right): live Kinesis Video stream for selected equipment.
For the maintenance investigation view, create a separate dashboard with deeper time ranges (24 hours, 7 days), maintenance record history from the Lambda connector, and side-by-side comparison of multiple sensors for root cause analysis.
Use Case 1: Remote Operations Center
The operations center use case is where most manufacturers see immediate ROI from TwinMaker. Instead of dispatching engineers to the factory floor to investigate alerts — or worse, discovering problems only when production stops — the operations team monitors the 3D facility from any location.
Scenario: Operations center in Chicago monitors three manufacturing facilities in Ohio, Michigan, and Indiana. All three facilities have TwinMaker digital twins displayed on the operations center dashboards.
At 2:15 AM, Hydraulic Press #7 in the Ohio facility turns yellow in the 3D scene — anomaly score has risen to 0.62. The on-call operations engineer sees this on their monitoring dashboard. They click Press #7 to open the detail view: temperature is elevated by 8°C over the 4-hour trend, vibration is within normal range, pressure is nominal. The live camera shows no visible smoke or fluid leak.
The engineer escalates to the Ohio facility’s on-call maintenance technician with a specific equipment ID, location, and the sensor data context. The technician checks on-site and finds a partially blocked coolant filter — a 20-minute cleaning job rather than an unplanned shutdown. Without TwinMaker, this might not have been discovered until temperature exceeded safety limits and triggered an automatic shutoff.
The operations center pattern reduces on-site staffing requirements for routine monitoring while improving response time to emerging issues — the combination that justifies TwinMaker investment for most manufacturers.
Use Case 2: Predictive Maintenance Investigation
Alert fires at 9:47 AM: Hydraulic Press #7 anomaly score has crossed 0.85 — red threshold. The Grafana dashboard sends a SNS notification to the maintenance team Slack channel.
The senior maintenance engineer opens the TwinMaker dashboard on their laptop. They navigate in the 3D scene to Building A, Line 3, and click on Press #7. The detail panel opens:
Current readings: Vibration: 4.2 mm/s (normal: <3.0 mm/s, elevated 40%). Temperature: 78°C (normal: 68-72°C). Pressure: nominal. Anomaly score: 0.87 (consistent with bearing degradation pattern).
Live video: Drive motor camera shows no visible damage. Bearing cover is intact.
Maintenance history (from Lambda connector → CMMS): Last bearing replacement: 14 months ago. OEM recommended interval: 18 months. Last vibration check: 3 months ago (reading: 3.4 mm/s).
Sensor history (7-day trend): Vibration has been trending up gradually for the past 10 days. Temperature correlation followed vibration trend after a 3-day lag. Classic early-stage bearing wear signature.
The engineer’s assessment: bearing wear is progressing faster than the OEM interval suggests (likely due to higher-than-rated load cycles on this line). Recommend bearing replacement at next planned shutdown window, not emergency intervention. They create a CMMS work order through the Lambda connector integration, flag the required parts (bearing kit #HB-7412), and set a re-check alarm for 72 hours.
This investigation — from alert to documented decision — took 12 minutes. Without TwinMaker, it would have required a site visit, manual review of paper maintenance logs, and separate SCADA login for sensor history. The digital twin compressed a 2-hour process into one coherent interface.
Use Case 3: OEE Dashboard and Plant-Level Visibility
Overall Equipment Effectiveness (OEE) is the primary KPI for manufacturing operations: the product of Availability, Performance, and Quality, expressed as a percentage. World-class OEE is typically 85%+.
TwinMaker’s entity hierarchy maps naturally to OEE aggregation:
- Equipment-level OEE: calculated from SiteWise asset properties (uptime, actual vs. target cycle time, defect rate). Displayed as a property on each equipment entity.
- Line-level OEE: aggregated from equipment entities on the line. The Line 3 entity has an OEE property computed by a Lambda component that averages equipment OEE for the line.
- Building-level OEE: aggregated from line entities.
- Factory-level OEE: top-level entity property.
The plant manager dashboard shows the factory entity hierarchy in the 3D scene, color-coded by OEE: green (>85%), yellow (70-85%), red (<70%). Drilling down from factory to building to line to equipment is a click-through in the 3D scene, not a separate report.
When Line 3 shows yellow (74% OEE), the plant manager clicks through to see that Press #7 is responsible — it has been running at 91% performance but 78% availability due to three unplanned stops this week. The SiteWise property history shows that all three stops correlated with high ambient temperature in the afternoon shift, suggesting a ventilation issue rather than equipment failure.
This level of root cause visibility — from plant-level KPI to specific causal factor — in a single interface is the operational value proposition of a well-built digital twin.
Integration with SiteWise Native Anomaly Detection
AWS IoT SiteWise introduced native anomaly detection in 2025, using ML models trained on your equipment’s historical sensor patterns to produce per-asset anomaly scores (0.0–1.0) without requiring a custom SageMaker deployment.
The integration with TwinMaker is straightforward: SiteWise anomaly scores appear as regular asset properties, which the SiteWise connector surfaces as TwinMaker entity properties. No custom Lambda connector is needed.
Configure Scene Composer conditional states to reference the anomaly_score property:
anomaly_score < 0.5→ green model coloranomaly_score >= 0.5 AND anomaly_score < 0.8→ yellowanomaly_score >= 0.8→ red
The 3D scene becomes a real-time health map of your entire facility — equipment health visible at a glance across every machine in the plant, driven by ML-based anomaly scores rather than simple threshold alarms.
Cost Optimization
TwinMaker pricing has two main components: a per-workspace monthly fee, and per-connector-read charges for data access.
The workspace fee is fixed and covers the knowledge graph, Scene Composer, and the TwinMaker API. The variable cost is connector reads — every time a dashboard panel refreshes and requests a property value, TwinMaker reads from the connector.
Optimize connector read volume:
-
Cache property values in TwinMaker. For slowly changing properties (maintenance records, equipment specifications), configure TwinMaker to cache the value and refresh on a schedule (every 5 minutes) rather than reading from the Lambda connector on every dashboard request.
-
Tune Grafana refresh intervals. A 3D scene overview panel does not need to refresh every 5 seconds — 30 seconds is sufficient for operational monitoring. Time-series panels for a specific equipment investigation can refresh more frequently (10 seconds) only when that equipment is actively selected.
-
Use SiteWise for real-time reads. SiteWise connector reads are significantly less expensive than Lambda connector reads. Route real-time sensor data through SiteWise; use Lambda connectors only for non-real-time data like maintenance records.
-
Right-size the workspace count. Each facility (or logical grouping) needs one workspace. Avoid creating separate workspaces for test and production digital twins if you can use naming conventions and entity tags to distinguish them within a single workspace during development.
When TwinMaker Is the Right Choice
TwinMaker adds the most value when these conditions hold:
Complex spatial relationships matter. A facility with a single production line and 20 sensors can be fully understood with a SiteWise + Managed Grafana dashboard. TwinMaker’s 3D spatial layer pays off when you have dozens of machines across multiple buildings and lines where location and adjacency affect operations and maintenance decisions.
Multiple stakeholder types use the same data. Operations engineers, maintenance technicians, plant managers, and remote support engineers all need access to facility data — but with different levels of detail and different context. TwinMaker’s entity model supports all of these views from the same underlying data, while SiteWise dashboards tend to be single-purpose.
Cross-system correlation is a daily need. If your maintenance team regularly needs to correlate sensor history, video, and CMMS records to diagnose issues, TwinMaker’s multi-source entity model eliminates the context switching between separate systems that currently extends investigation time.
For manufacturers meeting these criteria, TwinMaker moves digital twin from a pilot project to a production operational tool — the kind that changes how engineers work every day.
AWS Cloud Architect & AI Expert
AWS-certified cloud architect and AI expert with deep expertise in cloud migrations, cost optimization, and generative AI on AWS.