AWS Observability Costs: Cardinality Budgets & FinOps Limits
Quick summary: CloudWatch Logs Insights bills $0.005 per GB scanned and high-cardinality custom metrics multiply costs. Cardinality budgets, sampling rules, and FinOps fixes.
Key Takeaways
- CloudWatch Logs Insights bills $0
- 005 per GB scanned and high-cardinality custom metrics multiply costs
- On May 8, 2026, Amazon CloudWatch observability bills bite hardest where teams least audit them: Logs Insights at $0
- 005 per GB scanned (US East list pricing) and custom metrics that explode when a per-user-ID dimension lands on a hot path
- This guide is the FinOps view of AWS observability — cardinality budgets, sampling rules, and query hygiene that keep CloudWatch and OpenTelemetry costs predictable
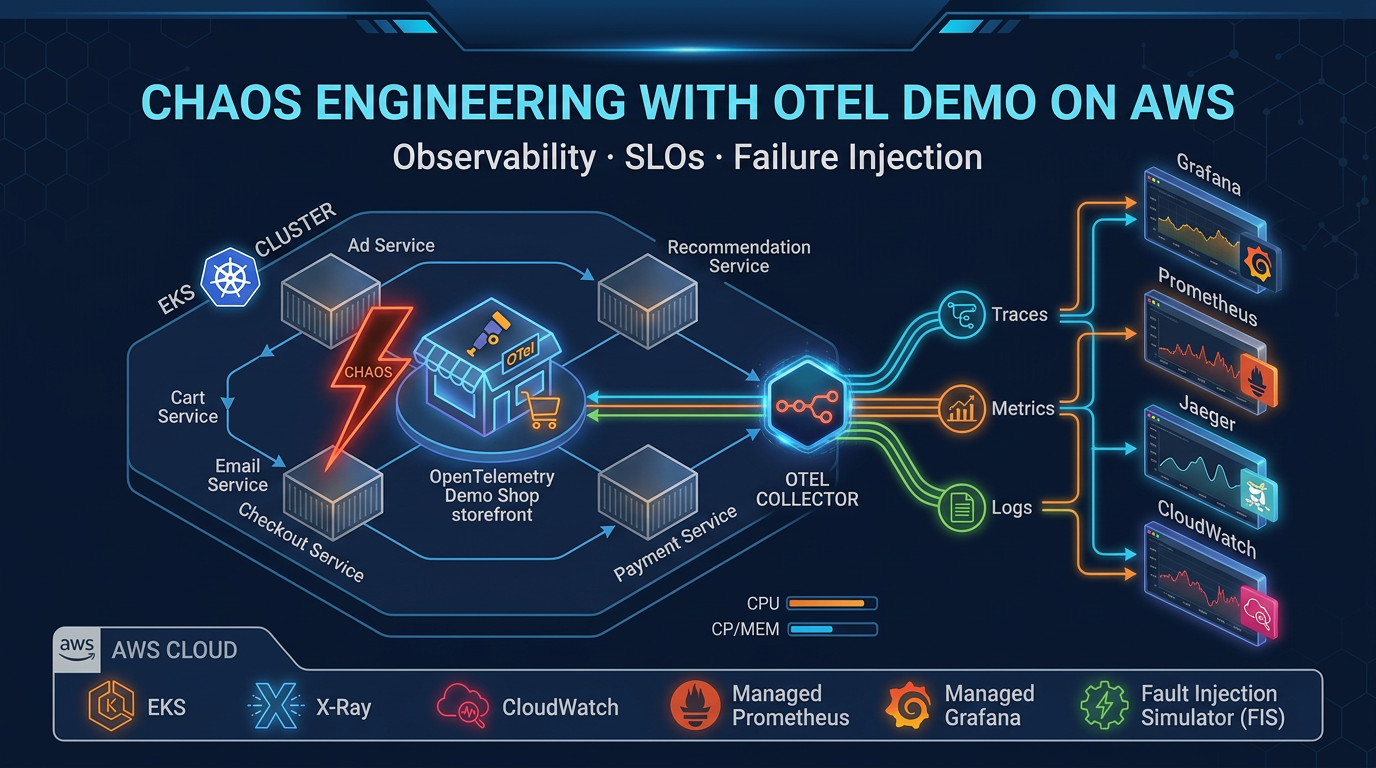
Table of Contents
On May 8, 2026, Amazon CloudWatch observability bills bite hardest where teams least audit them: Logs Insights at $0.005 per GB scanned (US East list pricing) and custom metrics that explode when a per-user-ID dimension lands on a hot path. A “cheap” wide query scheduled every minute, or a PutMetricData storm on a high-cardinality dimension, becomes a five-figure monthly line item before finance reads the dashboard.
This guide is the FinOps view of AWS observability — cardinality budgets, sampling rules, and query hygiene that keep CloudWatch and OpenTelemetry costs predictable. For the broader CloudWatch capability surface (metrics, logs, alarms, Application Signals), see CloudWatch observability best practices. For full FinOps remediation across compute and observability, see our AWS cloud cost optimization services.
Reproduce this — Paste starter queries from
examples/architecture-blog-2026/observability/logs-insights-queries.txtinto Logs Insights; replace log groups and trace IDs.
The three cost surfaces — metrics, logs, traces
- Custom metrics bill per dimension combination. Adding
user_idto a metric with 500k DAU creates 500k time series — that is not a metric, that is a database. - Logs Insights bills per GB scanned ($0.005/GB US East, May 2026). A
SELECT *across 30 log groups for “the last hour” is bigger than people think. - Traces bill per-span ingested in AWS X-Ray; without sampling rules, instrument-everything day one is the most expensive learning experience your team will have.
Cardinality budgets
Cardinality is the only observability concept where a single mis-applied tag silently triples your bill.
- Set a budget per service: max distinct dimension combinations per metric, max distinct attributes per trace span. Review weekly.
- Prefer aggregated business metrics with bounded dimensions (region, env, tier) over per-user-ID metrics. Use traces for per-user debugging, not metrics.
- Use embedded metric format (EMF) carefully — EMF generates metrics from log lines, which means a runaway log can mint runaway metrics.
What broke — A “temporary” debugging query (
SELECT *across 30 log groups) landed in a CI cron for weeks. Finance flagged an $18k monthly delta — logs were “cheap” until automation scaled humans out of the loop. Fix: query linting, required group filters, and budget alarms per log product.
Sampling — the lever most teams skip
- Head-based sampling (sample at trace start) is simple and predictable; default to it before tail-based.
- Tail-based sampling requires a collector tier (AWS Distro for OpenTelemetry, OTel Collector). Useful for keeping all error traces while dropping normal ones — if the rules do not accidentally keep 100% of “normal” anyway.
- Validate trace counts against billing weekly. Misconfigured rules look correct in code and silently re-include the world.
OpenTelemetry adoption pacing
Half-instrumented OpenTelemetry can cost more than central AWS X-Ray with known sampling rules. Phase adoption: critical paths first, tail-based sampling second, broad rollout last. For chaos-driven OTel learning, see OTel Demo Game.
Monitoring vs alerting — the cost link
Monitoring collects continuously; alerting routes to humans. The cost link: every alarm that fires more than twice a week without an action update is a candidate for deletion or re-tiering. Noisy alarms keep their underlying metric pipelines hot and humans paged.
Opinionated take — If an alert fires more than twice a week without an action checklist update, delete or re-tier the alarm — noisy paging is a security incident waiting for ignored fatigue.
Training wheels: real cost of skipping 24/7 monitoring quantifies the business risk of silent failure. Operational mantra from our distributed debugging guide: alert on metrics, triage with traces, diagnose with logs.
FinOps coupling
Observability spend belongs in the same review as compute. Filter Cost Explorer to Amazon CloudWatch (and related telemetry services), then use Analyze with Amazon Q (June 2026) to narrate which usage types drove the line item — faster than exporting CSVs for finance. Cross-references: Cost Explorer guide, engineering cost ownership, and logging cost deep dive.
What This Post Doesn’t Cover
- Third-party APM pricing negotiations — vendor-specific.
- Security analytics in Security Lake vs CloudWatch — different retention/compliance story (Security Lake guide when OCSF normalization matters).
- Capability deep dive on metrics, logs, alarms, Application Signals — that lives in CloudWatch observability best practices.
If You Only Do One Thing
Set a per-service cardinality budget and review it weekly with finance. Every other observability cost lever flows from that one number.
What to Do This Week
- Inventory scheduled Logs Insights queries; delete or constrain time windows.
- Audit every
PutMetricDatacall for per-user-ID or per-request-ID dimensions; remove or move to traces. - Verify W3C trace context crosses service boundaries in staging (not just Lambda console traces).
- Pair every new alarm with a runbook link or delete the alarm — no orphan pages.
When resilience patterns intersect telemetry, read retries, circuits, and graceful shutdown.
AWS Cloud Architect & AI Expert
AWS-certified cloud architect and AI expert with deep expertise in cloud migrations, cost optimization, and generative AI on AWS.