Logging Yourself Into Bankruptcy
Quick summary: Observability is not free, and the industry has collectively underpriced it. CloudWatch log ingestion, metrics explosion, and X-Ray trace volume can together exceed your compute bill — especially once AI workloads introduce high-cardinality telemetry at scale.
Key Takeaways
- CloudWatch log ingestion, metrics explosion, and X-Ray trace volume can together exceed your compute bill — especially once AI workloads introduce high-cardinality telemetry at scale
- CloudWatch log ingestion, metrics explosion, and X-Ray trace volume can together exceed your compute bill — especially once AI workloads introduce high-cardinality telemetry at scale
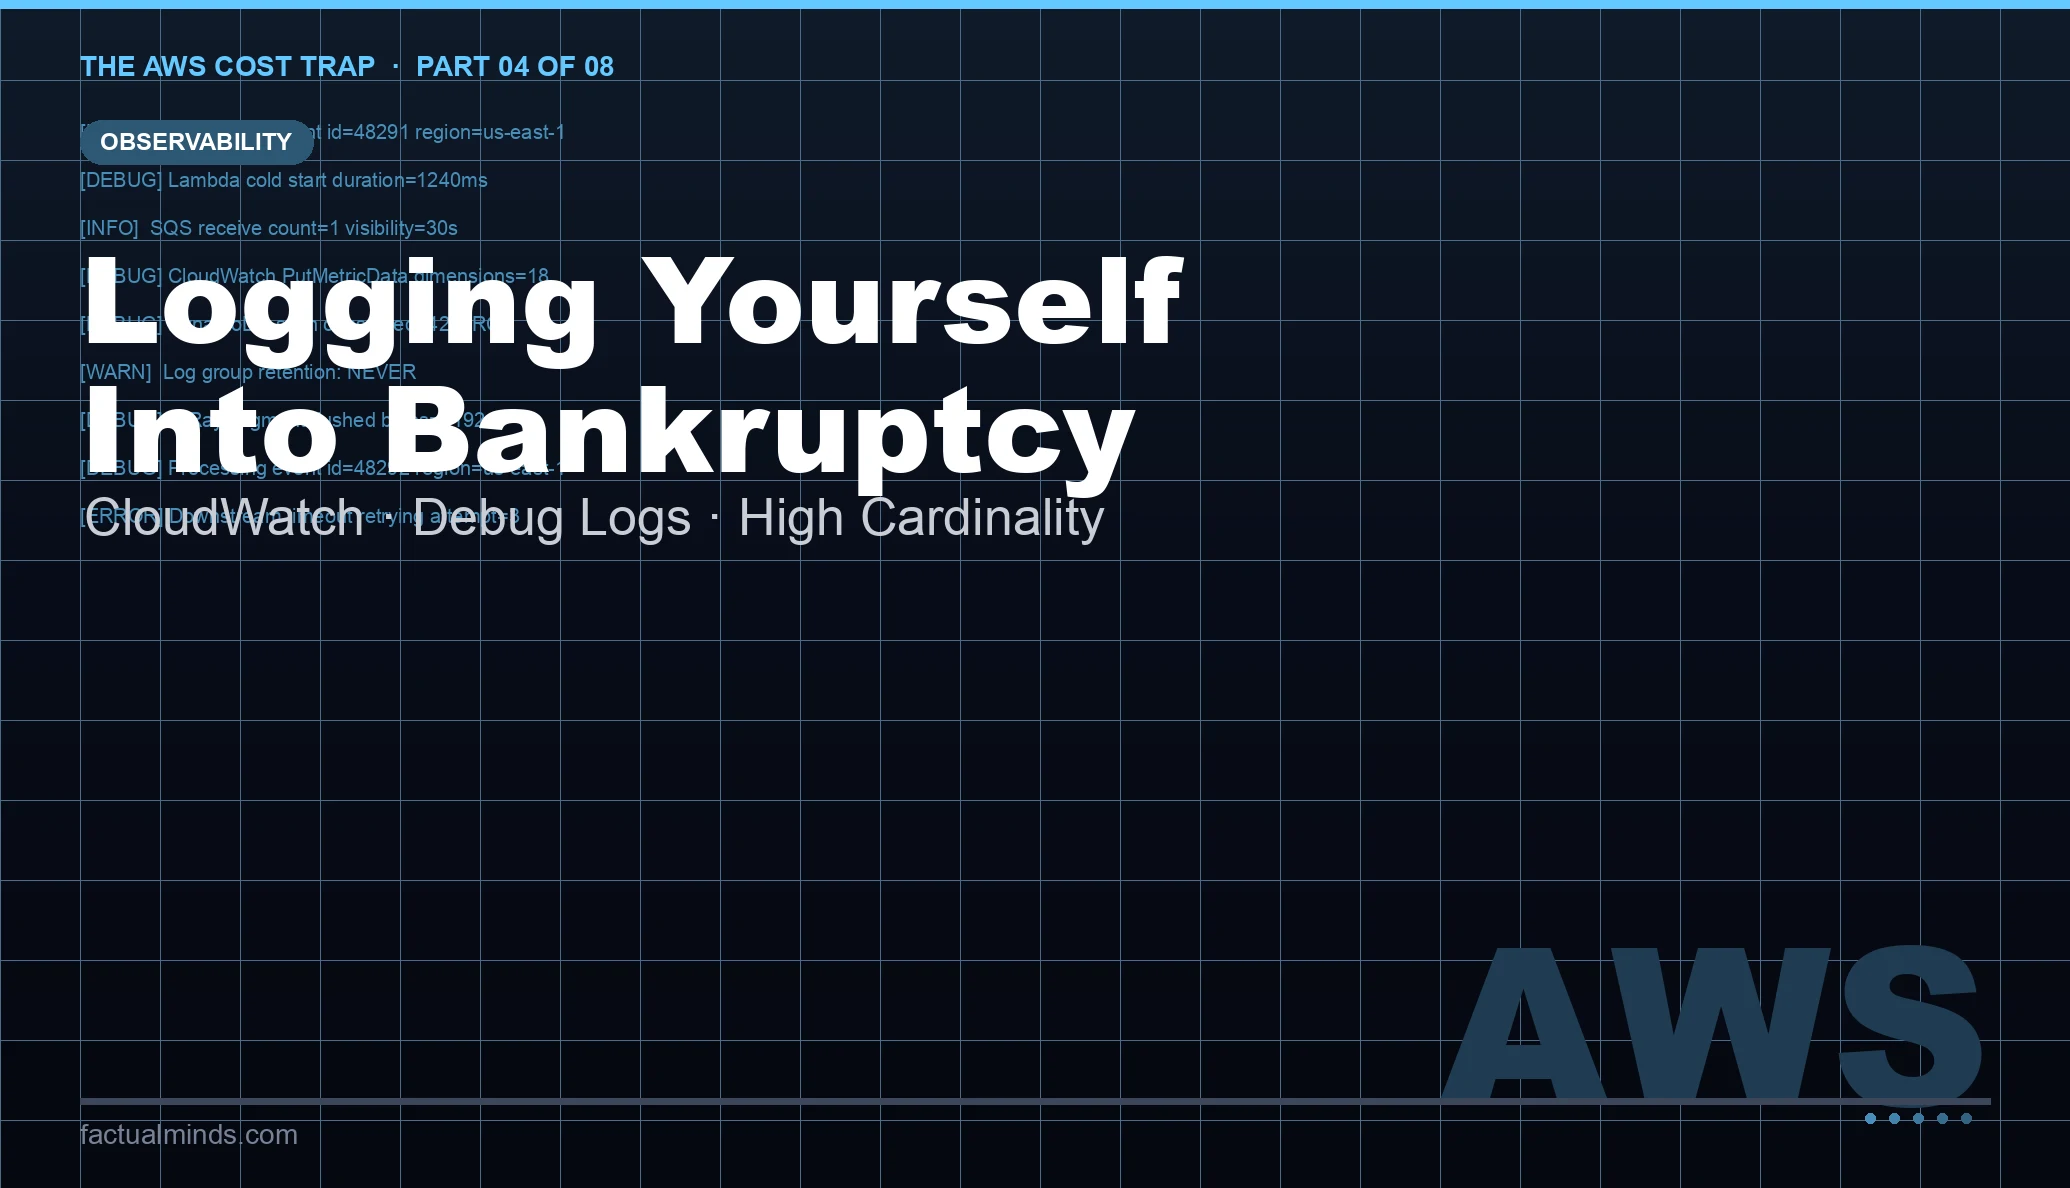
Table of Contents
Part 4 of 8: The AWS Cost Trap — Why Your Bill Keeps Surprising You
The team had a production incident. Diagnosis took four hours because the logs were sparse and the metrics were coarse. Leadership mandated: improve observability. Engineers added structured logging at DEBUG level across all services. They added custom CloudWatch metrics for every business event: user logins, search queries, checkout steps, payment outcomes. They enabled X-Ray tracing at 100% sampling. They built twelve CloudWatch dashboards. They added an alarm for every metric.
Six weeks later, observability costs exceeded compute costs. The system was now extremely visible, and extremely expensive to observe.
This is not a rare pattern. It is the predictable outcome of treating observability as a pure benefit with no cost dimension. In AWS, observability has a detailed and unforgiving pricing model. The cost of knowing what your system is doing can approach the cost of the system doing it.
CloudWatch Log Pricing: The Ingestion Problem
CloudWatch Logs charges on three dimensions: ingestion (per GB ingested), storage (per GB per month), and query execution (per GB scanned by Logs Insights queries). Of these, ingestion is the most volatile and the hardest to forecast.
Log ingestion cost is proportional to log volume, which is proportional to the verbosity of your logging configuration multiplied by your request throughput. The relationship is linear per request, which means log costs scale directly with traffic — no economy of scale, no discount tiers. At 100,000 requests per day with 1 KB average log output per request, you ingest approximately 100 GB per month. At 1,000,000 requests per day, you ingest 1,000 GB per month.
DEBUG logging in production is the most common cause of unexpectedly high log ingestion costs. A service that logs at DEBUG level during development, then deploys to production with the same configuration, emits orders of magnitude more log data than a service logging at INFO or WARN. Framework-level debug logging — from HTTP clients, database drivers, serialization libraries — can add hundreds of log lines per request that are invisible to the application developer because they come from dependencies.
The specific failure mode: a service is deployed to production with DEBUG logging enabled. It serves production traffic for 30 days. On day 31, the monthly bill is reviewed and CloudWatch shows 3 TB of log ingestion from a service that handles 200,000 requests per day. The cause is immediately clear in retrospect — it is never caught proactively because no one monitors log ingestion volume as an operational metric.
Lambda log amplification. Every Lambda invocation automatically writes START, END, and REPORT log lines to CloudWatch Logs — regardless of what the function code logs. At millions of invocations per day, these three lines alone constitute a material log volume. Add application-level logging inside the function, and the volume multiplies. Lambda functions that log the full event payload — which is common during development and frequently never removed — log potentially kilobytes per invocation at a scale that generates gigabytes per hour.
Container logs. ECS and EKS tasks write stdout/stderr to CloudWatch Logs via the awslogs log driver. Every container in every task emits all stdout to CloudWatch. In microservices deployments with dozens of service types and hundreds of tasks, the aggregate log volume from container stdout can exceed what any single engineer expects because no individual service looks expensive — only the aggregate is.
CloudWatch Metrics: Cardinality Explosion
CloudWatch custom metrics are charged per unique metric per month, with a free tier for the first 10 metrics. The critical word is “unique.” A metric is uniquely identified by its namespace, metric name, and the combination of its dimension names and values.
Namespace: MyApp/Payments, MetricName: ProcessingTime is one metric.
Namespace: MyApp/Payments, MetricName: ProcessingTime, Dimensions: {UserId: 12345} is a different metric than {UserId: 67890}. If your application publishes processing time per user, you have as many metrics as you have users. At 100,000 users, you have 100,000 metrics. At the standard pricing rate, that is a substantial monthly charge — for a single metric name across a single user dimension.
This cardinality explosion is triggered by any dimension with high cardinality: user IDs, session IDs, request IDs, order IDs, product SKUs. Engineers who come from observability tools that handle high-cardinality natively (Datadog, Honeycomb, Prometheus with label cardinality managed externally) apply the same patterns in CloudWatch and encounter billing behavior that those tools insulate them from.
The rule for CloudWatch custom metrics: dimensions must have bounded, low cardinality. Environment (prod/staging/dev), region, service name, error type, status code — these are appropriate dimensions. User identifiers, transaction identifiers, and any identifier that grows with your user base are not appropriate dimensions. High-cardinality observability belongs in CloudWatch Logs Insights (where you pay per GB scanned for queries, not per unique value at ingestion time), not in custom metrics.
Metrics from EC2 and containers. The default CloudWatch metrics for EC2, ECS, and EKS are standard metrics, not custom metrics, and are charged at a lower standard metric rate. But Container Insights — the enhanced observability layer for ECS and EKS — publishes custom metrics at high frequency per container, per service, per cluster. A large EKS cluster with Container Insights enabled can generate thousands of custom metrics that sum to substantial monthly charges. Container Insights is useful, but it should be explicitly costed before enabling in production.
CloudWatch Alarms: The Cost of Alerting
Each CloudWatch alarm is charged per alarm per month, with different rates for standard resolution (1-minute evaluation) and high-resolution (10-second evaluation) alarms. Composite alarms (alarms that combine other alarms using logical operators) are charged at a higher rate.
The alarm cost failure pattern is incremental accumulation. Alarms are easy to create and painful to delete (because deleting an alarm feels like reducing observability). Over months, an AWS account accumulates hundreds of alarms — many alerting on metrics that no longer matter, many set to thresholds that were never calibrated, many duplicated across environments. The monthly alarm charge across 500 alarms is not enormous in absolute terms, but it is pure waste — paying for alerts that no one acts on.
The deeper issue with alarm proliferation is signal-to-noise ratio degradation. An on-call rotation that receives 200 CloudWatch alarms per week trains itself to ignore them. An alarm system that generates constant noise reduces the detectability of the alarms that actually matter. The cost of too many alarms is not just the CloudWatch charges — it is the reduction in incident detection effectiveness.
X-Ray Tracing: 100% Sampling Is Not Free
AWS X-Ray charges per trace recorded and per trace retrieved/scanned. The cost per million traces is not high in isolation. At 100% sampling on a service handling tens of millions of requests per day, it adds up.
The specific failure pattern is 100% sampling configured during development and never reduced for production. X-Ray sampling rules allow you to configure sampling rates by service, by URL path, and by other trace attributes. A well-configured sampling strategy captures 100% of error traces (so you never miss a failure), a percentage of traces for high-value operations (checkout flows, payment processing), and a low percentage of traces for routine operations (health checks, static asset serves).
Health check endpoints sampled at 100% are a classic waste. A load balancer health check fires every 30 seconds per target. At 50 ECS tasks, you have 1,500 health check traces per hour, 36,000 per day, 1,080,000 per month — traced at full detail, stored in X-Ray, and billed accordingly. A sampling rule that drops health check traces entirely costs nothing and loses nothing diagnostically.
X-Ray and high-volume Lambda. Lambda with X-Ray active adds latency and cost. The trace segment for each invocation is sent to the X-Ray daemon as a UDP packet. At high concurrency, the UDP send can become a bottleneck for short-duration functions. The traced data is billed regardless of whether it is ever queried. For Lambda functions invoked millions of times per day where tracing is not actively used in debugging, X-Ray sampling should be reduced to a fraction of a percent or disabled.
Retention Misconfigurations
CloudWatch Logs storage is billed per GB per month with no automatic expiry. The default retention policy for a new CloudWatch Log Group is “Never Expire” — meaning logs accumulate indefinitely and are billed for storage indefinitely.
An account that creates log groups as services are deployed and never sets retention policies accumulates years of log data, most of it irrelevant to any operational need. A log group storing 2 years of debug-level logs from a service that has since been rewritten is storing data that no engineer will ever query — but the storage charge continues until someone explicitly changes the retention policy.
Setting retention policies should be part of your log group provisioning process, not an afterthought. Most workloads have no operational need for logs older than 90 days. Security and compliance requirements may extend that for specific log sources (CloudTrail, VPC Flow Logs, ALB access logs), but application debug logs rarely need to be retained beyond 30 days.
The mechanism to enforce this at scale is straightforward: use CloudFormation, CDK, or Terraform to create all log groups with explicit retention periods. Audit existing log groups with no retention policy using aws logs describe-log-groups --query 'logGroups[?retentionInDays==null]' and set policies in bulk. This is a one-time remediation that reduces storage costs immediately and prevents accumulation going forward.
Building a Cost-Aware Observability Strategy
The solution to observability cost is not less observability. It is observability that is designed with cost as a constraint, the same way performance and reliability are constraints.
Log what matters, not everything:
- ERROR and WARN levels: log everything, retain indefinitely (or per compliance requirement)
- INFO level: log key business events and operational decisions, 90-day retention
- DEBUG level: never in production; use sampling flags or feature flags to enable temporarily when needed
Metric dimensions must be low-cardinality by design. Before publishing a custom metric, ask: how many unique values can this dimension have? If the answer is “it scales with user count,” use structured logs and Logs Insights instead.
X-Ray sampling rules by operation type:
- Errors and faults: 100% sampling always
- Business-critical operations: 5–10% sampling
- Health checks and routine operations: 0% or 0.1% sampling
Set retention policies on all log groups. Automate this through infrastructure-as-code. Review logs older than your retention policy for data you actually need before deleting — but be honest that most of it is not needed.
Monitor your monitoring costs. Create a CloudWatch metric for log ingestion volume per log group. Alert when a log group exceeds its expected daily ingestion volume. A spike in log ingestion from a specific service is as much a signal as a spike in error rate — it may indicate debug logging was accidentally re-enabled, or a verbose logging path is being hit unexpectedly.
Observability is infrastructure. Like all infrastructure, it must be designed, not accumulated.
Related reading: AWS CloudWatch Observability: Metrics, Logs, and Alarms Best Practices is the operational companion to this post — it covers alarm design, Logs Insights query patterns, Application Signals, and X-Ray integration from a how to configure correctly perspective. This series post focuses on the billing failure modes those configurations produce at scale. For structured logging patterns that reduce both cost and debugging friction, see that guide’s structured logging section.
Next in the series: Part 5 — S3 Is Not Cheap — Your Usage Is Expensive. S3 request pricing, lifecycle misconfigurations, replication cost traps, and the small object problem creating storage bills that have nothing to do with how much data you store.
The AWS Cost Trap — Full Series
Part 1 — Billing Complexity as a System Problem · Part 2 — Data Transfer Costs · Part 3 — Autoscaling + AI Workloads · Part 4 — Observability & Logging Costs · Part 5 — S3 Storage Cost Traps · Part 6 — The FinOps Gap · Part 7 — Real Failure Patterns · Part 8 — Optimization Playbook
AWS Cloud Architect & AI Expert
AWS-certified cloud architect and AI expert with deep expertise in cloud migrations, cost optimization, and generative AI on AWS.