AWS Pricing Is Not Transparent — It's Emergent Behavior
Quick summary: AWS publishes every price publicly, yet bills still surprise teams in 2026. Costs emerge from service interactions — now including Bedrock/AgentCore — not from any single rate card.
Key Takeaways
- AWS publishes every price publicly, yet bills still surprise teams in 2026
- Costs emerge from service interactions — now including Bedrock/AgentCore — not from any single rate card
- An S3 bucket receives uploads
- A Lambda function resizes each object, writes back to S3, and logs to CloudWatch
- The whiteboard estimate — Lambda + S3 storage — lands under $50/month
Table of Contents
Part 1 of 8: The AWS Cost Trap — Why Your Bill Keeps Surprising You
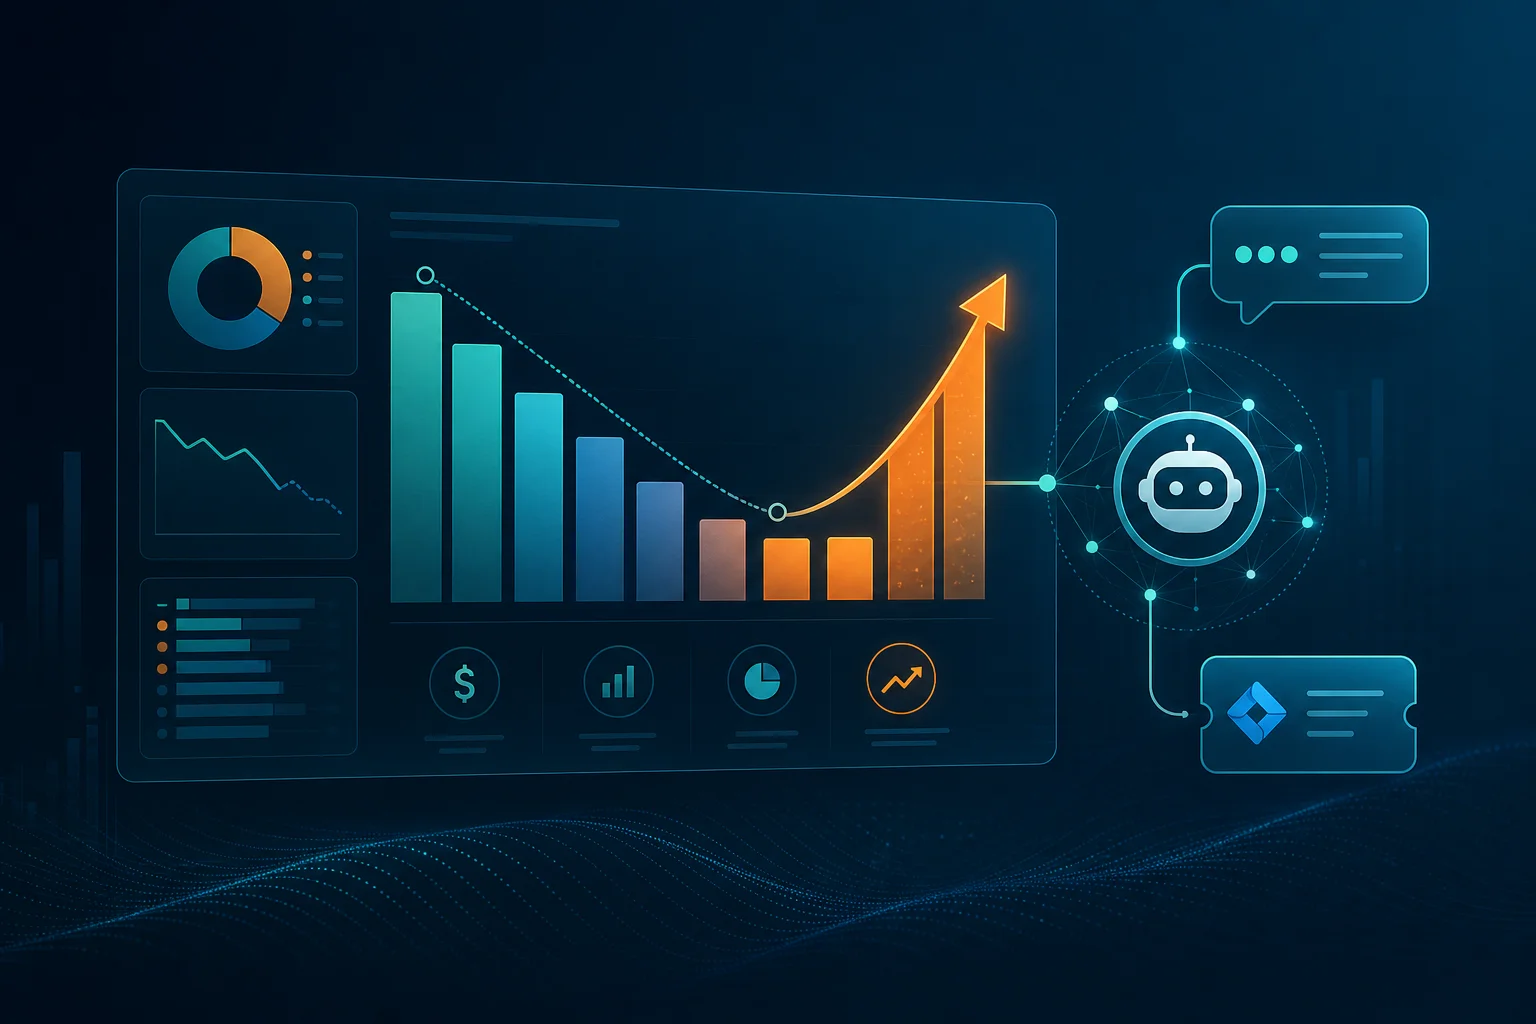
Series tooling (July 2026): Spike investigation starts in Cost Explorer with Analyze with Amazon Q; proactive alerts via Cost Anomaly Detection; automated routing with FinOps Agent (preview).
A team builds a simple image processing pipeline. An S3 bucket receives uploads. A Lambda function resizes each object, writes back to S3, and logs to CloudWatch. The whiteboard estimate — Lambda + S3 storage — lands under $50/month.
Three months later the bill is $4,300.
Nothing broke. No runaway loop. The system worked as designed. The cost was the architecture — and as of July 2026 the same pattern shows up in GenAI stacks: Bedrock invokes spawn AgentCore runtime minutes, CloudWatch traces, and S3 artifact writes that never appear on the model pricing page alone.
This is emergent AWS billing. You cannot read it off one rate card. It appears when you trace interactions at real throughput.
The Myth of Transparent Pricing
AWS is often accused of pricing opacity. That framing is wrong, and it matters that it is wrong — because it leads teams to solve the wrong problem.
Every AWS price is published. EC2 instance costs are available by instance family, region, OS, and tenancy. S3 has a public pricing table for storage tiers, request types, and data retrieval. Lambda publishes per-invocation and per-GB-second rates. CloudWatch lists ingestion, storage, and query costs.
Transparency is not the problem. Composability is the problem.
Real workloads do not consume one service. They consume five services simultaneously, each generating demand in the other four. A Lambda invocation writes a log. That log is ingested into CloudWatch. That CloudWatch metric fires an alarm evaluation. That alarm is queried by a dashboard. That dashboard is opened twelve times by engineers investigating the alert. Each of those actions has a price. None of them appears on the Lambda pricing page.
The cost of your system is not the sum of the cost of its parts. It is the sum of the cost of all interactions between its parts. At scale, interactions dominate.
Pricing Dimensions Explosion
To understand why estimation fails, you have to first map how many independent billing dimensions exist per service. Most engineers think of one or two. The actual number is much higher.
Amazon EC2 bills on: instance type, region, OS license, tenancy (shared/dedicated/host), purchase type (on-demand/reserved/spot), usage hours, data transfer out, and — critically — EBS volumes attached to the instance. Each attached EBS volume has its own billing: provisioned GB per month, IOPS (for io1/io2), throughput (for gp3), and snapshot storage. A “t3.medium” running 730 hours is a known quantity. That same instance with a 200 GB gp3 volume, 6000 IOPS provisioned, and daily cross-region snapshots is a different calculation entirely.
Amazon S3 bills on: storage volume per storage class, PUT/COPY/POST/LIST requests, GET requests, DELETE requests, data retrieval (for non-standard tiers), S3 Select queries, S3 Replication transfers, lifecycle transition requests, and data transfer out to the internet or other regions. Developers routinely estimate storage cost and forget request cost. At high object velocity — millions of small files, frequent listing operations, or aggressive replication — request pricing exceeds storage pricing by an order of magnitude.
AWS Lambda bills on: number of invocations, GB-seconds of compute (duration × memory allocation), and — often overlooked — provisioned concurrency when enabled. Lambda also drives indirect costs: every invocation typically touches at least one other service (SQS, DynamoDB, S3, SNS), and every invocation by default emits at least a START, END, and REPORT log line to CloudWatch Logs. At millions of invocations per day, the CloudWatch ingestion cost from Lambda alone can exceed the Lambda compute cost.
Amazon CloudWatch bills on: metrics (number of custom metrics published per month), dashboards, alarms (per alarm per month), log ingestion (per GB ingested), log storage (per GB per month beyond the free tier), and Logs Insights queries (per GB scanned). The metric dimension is particularly dangerous: CloudWatch prices per unique metric, and metrics with high-cardinality dimensions — such as per-user or per-request-ID — multiply rapidly. A single PutMetricData call can publish dozens of metrics. Thousands of services doing this continuously creates a metric sprawl that bills at scale.
Hidden Multipliers
Beyond per-service dimension explosion, three multiplier effects are consistently underestimated.
Cross-AZ data transfer. AWS charges for data moving between Availability Zones within the same region. This rate is small per GB, but architectures that distribute compute across AZs for resilience — which is correct practice — and then move data between those AZs at high volume create substantial costs. A microservices architecture where Service A in us-east-1a calls Service B in us-east-1b on every request, at thousands of requests per second, generates continuous cross-AZ transfer charges. No component of the architecture looks expensive in isolation. The interaction is expensive.
NAT Gateway. A NAT Gateway is required for private subnet resources to reach the internet. AWS charges per hour of NAT Gateway operation and per GB of data processed through it. The per-GB charge is where systems break. Every Lambda function in a private VPC routing through a NAT Gateway to reach DynamoDB, S3, or any AWS service pays the NAT data-processed rate — unless VPC Endpoints are configured. Developers choose private subnets for security and assume VPC endpoints are an optimization they can add later. By the time they add them, they have paid for months of unnecessary NAT throughput.
API call pricing. Several AWS services charge per API call in ways that are not obvious from pricing pages. Amazon CloudWatch PutMetricData is charged per API call, which maps to per-metric-batch, not per-metric. Systems that publish metrics at high frequency with small batches pay more than systems that batch efficiently. AWS Secrets Manager charges per API call to retrieve secrets. Applications that retrieve secrets on every request — rather than caching — generate continuous API call charges that can exceed the baseline Secrets Manager storage cost by two orders of magnitude. AWS Systems Manager Parameter Store has a standard tier with no API call charges and an advanced tier that does; the wrong tier selection under load becomes material.
Non-Linear Scaling Effects
Cost does not scale linearly with traffic. This is the core of why estimates fail.
A system handling 10,000 requests per day has certain CloudWatch log volumes, certain S3 request rates, certain DynamoDB read/write units consumed. At 1,000,000 requests per day — 100× growth — you would expect costs to grow roughly 100×. In practice, they often grow 200–500× because:
- Log verbosity per request is constant, but log volume drives CloudWatch Insights query costs that grow with scan volume
- Caches that hit at low traffic miss at high traffic, sending more requests to origin services
- Concurrency limits hit on databases and downstream services trigger retries, which generate additional API calls and logs
- Alarm evaluation frequency is unchanged but becomes a larger fraction of CloudWatch costs as custom metrics proliferate
- Data transfer out tiers have volume discounts at very high scale, but the discount breakpoints are rarely reached before other costs dominate
The inflection point is different for every architecture, but it almost always exists. Estimates built on low-traffic observations and scaled linearly will underestimate cost at production scale.
Why Estimates Fail
AWS cost estimates fail for a predictable set of reasons:
Request costs are excluded. Calculators focus on compute hours and storage. S3 GET requests, DynamoDB reads, CloudWatch API calls, and Secrets Manager calls are omitted as “minor.” At scale, they are not minor.
Data transfer is underestimated. Architects know about internet egress. They forget cross-AZ transfer, NAT Gateway throughput, and inter-service data movement. These are often the largest line items on bills that shocked their owners.
Indirect services are not modeled. An estimate for Lambda does not include the CloudWatch Logs cost that Lambda generates, the X-Ray traces that are sampled, or the SQS receives that trigger the Lambda. Each service spawns indirect charges in adjacent services.
Load profiles are wrong. Estimates use average load. Real systems have peaks, retry storms, batch windows, and traffic spikes. Costs during peaks are disproportionately high.
Dimensions interact. The price of enabling S3 Cross-Region Replication is not just the replication transfer cost — it is the replication transfer cost plus the PUT request cost on the destination bucket for every replicated object plus the storage cost in both regions plus any retrieval costs if the source is in a non-standard storage class.
What to Measure Instead of Estimate
Rather than trusting pre-build estimates, instrument the cost dimensions that matter during development and staging.
In Cost Explorer, enable hourly granularity and group by service and usage type — not just service. USW2-DataTransfer-Regional-Bytes and USE1-DataTransfer-Out-Bytes are different line items that both appear under “Data Transfer.” Grouping only by service hides the split.
Set up CloudWatch metric math to track your primary cost drivers as operational metrics: log ingestion volume per hour, S3 request rate per hour, Lambda invocation count per hour. Treat cost as an operational signal, not a monthly report.
Use AWS Cost Anomaly Detection with tight thresholds. The default thresholds are calibrated for large accounts. On a growing workload, set anomaly thresholds at 20–30% above your expected baseline so spikes surface within hours, not billing cycles.
Run production load at 1% scale before full launch. A single day at 1% of expected production throughput, with Cost Explorer hourly data, gives you a 100× extrapolation baseline that includes all interaction effects.
The Architectural Implication
The correct response to emergent billing complexity is not to build a better spreadsheet. It is to design architectures where the interactions between services are bounded and visible.
This means:
- Explicit data movement budgets. Every cross-service call moves data. Treat that data movement as a first-class architectural constraint, not an implementation detail.
- VPC Endpoints as default. Never route AWS service traffic through NAT Gateway unless there is a specific reason. VPC Endpoints eliminate the NAT processing charge for supported services.
- Log-level discipline in production. DEBUG logs belong in development. INFO logs should be sparse in production. Verbose logging that made sense in a test environment becomes a CloudWatch Logs billing driver at scale.
- Custom metric cardinality caps. Before publishing a custom CloudWatch metric, ask what its cardinality is. Per-user, per-session, and per-request dimensions create a metric for every unique value. Use structured logs and Logs Insights queries for high-cardinality observability instead.
AWS billing is not opaque. It is complex the way distributed systems are complex — the whole is not the sum of the rate cards. Treating it as a spreadsheet problem is the expensive mistake.
When this advice fails
- Single-service toy workloads — a lone
t4g.smallwith no logging still maps to a pricing page. - You already meter every interaction in staging — keep doing that; this post is for teams that only estimate.
- Commitment discounts hide unit economics — Savings Plans change the bill shape but not the interaction physics.
What to do Monday morning
- In Cost Explorer, enable hourly view; group by usage type (not only service) for the last 14 days.
- List the top five interaction multipliers in your architecture (cross-AZ, NAT, log GB, API calls, model tokens).
- Turn on Cost Anomaly Detection with a threshold tight enough to page within hours.
- Run a 24-hour 1% production-load soak and extrapolate — capture CloudWatch + data-transfer line items.
- For GenAI paths, add AgentCore/Bedrock runtime + observability to the estimate worksheet, not just $/1M tokens.
- Read Part 2 — Data Transfer next if regional bytes dominate.
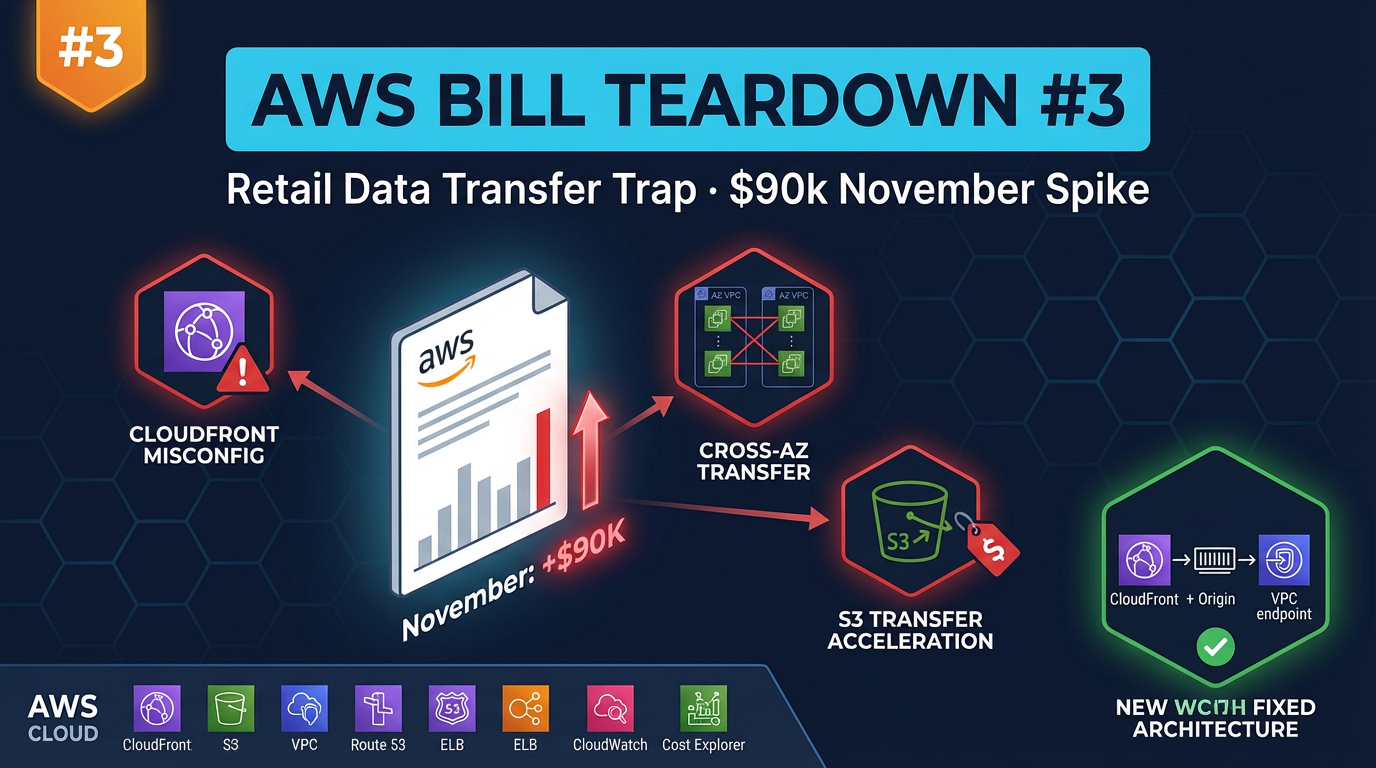
Related: Cost Explorer & Budgets · Well-Architected six pillars · Retail data-transfer teardown
Next: Part 2 — Data Transfer: The Line Item That Breaks Startups.
The AWS Cost Trap — Full Series
Part 1 — Billing Complexity as a System Problem · Part 2 — Data Transfer Costs · Part 3 — Autoscaling + AI Workloads · Part 4 — Observability & Logging Costs · Part 5 — S3 Storage Cost Traps · Part 6 — The FinOps Gap · Part 7 — Real Failure Patterns · Part 8 — Optimization Playbook
AWS Cloud Architect & AI Expert
AWS-certified cloud architect and AI expert with deep expertise in cloud migrations, cost optimization, and generative AI on AWS.