Building Real-Time Analytics Dashboards with AWS QuickSight
Quick summary: A practical guide to AWS QuickSight for business intelligence — data source integration, SPICE performance, embedded analytics, row-level security, and cost-effective dashboard patterns.
Key Takeaways
- A practical guide to AWS QuickSight for business intelligence — data source integration, SPICE performance, embedded analytics, row-level security, and cost-effective dashboard patterns
- A practical guide to AWS QuickSight for business intelligence — data source integration, SPICE performance, embedded analytics, row-level security, and cost-effective dashboard patterns

Table of Contents
Every organization generates data. Few organizations make that data accessible to the people who need it for decisions. The gap between “we have data” and “we make data-driven decisions” is usually filled by analytics dashboards — and AWS QuickSight is the serverless BI service that closes that gap without the infrastructure overhead of traditional BI tools.
QuickSight integrates natively with AWS data sources, scales to thousands of users without capacity planning, and costs a fraction of traditional BI platforms. This guide covers the patterns for building production-grade analytics dashboards that your team will actually use.
Why QuickSight
Serverless BI
Traditional BI tools (Tableau Server, Power BI Report Server, Looker) require dedicated infrastructure — servers, databases, storage, and capacity planning for peak concurrent usage. QuickSight eliminates all of that:
- No servers to provision or manage
- No capacity planning — scales automatically to thousands of concurrent users
- Pay-per-session pricing (reader users) or flat-rate (author users)
- SPICE in-memory engine handles queries without loading your source databases
Cost Comparison
Pricing Note: Pricing as of February 2026. Vendor pricing and plan structures change frequently. Verify current rates at AWS QuickSight Pricing, Tableau Pricing, Power BI Pricing, and Looker Pricing.
| Tool | 100 Dashboard Viewers | 500 Dashboard Viewers |
|---|---|---|
| QuickSight (Reader) | $50/month (pay-per-session) | $250/month |
| Tableau Server | $3,500/month (licenses + server) | $17,500/month |
| Power BI Premium | $5,000/month (capacity-based) | $5,000-$10,000/month |
| Looker | Custom pricing | $3,000-$10,000/month |
QuickSight’s reader pricing ($0.30 per session, max $5/user/month) makes it dramatically cheaper for organizations where most users view dashboards occasionally rather than daily.
Data Source Integration
Native AWS Sources
QuickSight connects directly to AWS data services without any additional infrastructure:
| Data Source | Connection Type | Best For |
|---|---|---|
| Amazon Athena | Direct query or SPICE | Ad-hoc analytics over S3 data lakes |
| Amazon Redshift | Direct query or SPICE | Data warehouse analytics |
| Amazon RDS/Aurora | Direct query or SPICE | Operational database reporting |
| Amazon S3 | Via Athena or SPICE import | Raw file analysis (CSV, JSON, Parquet) |
| Amazon OpenSearch | Direct query | Log and event analytics |
| Amazon Timestream | Direct query | IoT and time-series analytics |
External Sources
QuickSight also connects to non-AWS data sources:
- JDBC/ODBC — Any database with a JDBC driver (MySQL, PostgreSQL, SQL Server, Oracle)
- SaaS connectors — Salesforce, ServiceNow, Jira, GitHub (via QuickSight native connectors)
- APIs — Custom data sources via Lambda functions that return data to QuickSight
- File upload — CSV, TSV, Excel files uploaded directly to SPICE
Data Preparation
QuickSight’s built-in data preparation handles common transformation needs without a separate ETL pipeline:
- Joins — Combine data from multiple sources (inner, left, right, full outer)
- Calculated fields — Create derived metrics using SQL-like expressions
- Filters — Pre-filter data at the dataset level to reduce SPICE storage
- Data type conversion — Parse dates, convert strings to numbers, normalize formats
For complex transformations, prepare data upstream using AWS Glue or Athena views and connect QuickSight to the transformed output.
SPICE: In-Memory Analytics Engine
SPICE (Super-fast, Parallel, In-memory Calculation Engine) is QuickSight’s in-memory data store. When you import data into SPICE, QuickSight creates an optimized, columnar representation that enables sub-second query performance regardless of data volume.
When to Use SPICE
| Scenario | SPICE | Direct Query |
|---|---|---|
| Dashboard load time | Sub-second | Depends on source database |
| Source database load | None (data cached in SPICE) | Every dashboard view queries the source |
| Data freshness | Scheduled refresh (hourly minimum) | Real-time |
| Cost | SPICE storage ($0.38/GB/month) | Source database query costs |
| Best for | Dashboards viewed frequently by many users | Real-time operational dashboards, very large datasets |
Recommendation: Use SPICE for most dashboards. The performance improvement and reduced load on source databases justifies the storage cost. Use Direct Query only when you need real-time data (within minutes) or when the dataset exceeds SPICE storage limits.
SPICE Refresh Strategies
- Full refresh — Replaces all data in SPICE. Simple but slow for large datasets. Schedule during off-peak hours.
- Incremental refresh — Appends new records based on a date column. Faster than full refresh for time-series data. Configure the lookback window (e.g., refresh last 7 days of data).
- API-triggered refresh — Trigger SPICE refresh from a Lambda function or Step Functions workflow when upstream data processing completes. This ensures dashboards update immediately after ETL jobs finish.
ETL Pipeline → Glue Job completes → EventBridge rule → Lambda → QuickSight CreateIngestion API → SPICE refreshesDashboard Design
Visual Types
QuickSight offers 20+ visual types. Choose based on what question the data answers:
| Question | Visual Type | Example |
|---|---|---|
| How is the metric trending? | Line chart | Revenue over time |
| How do categories compare? | Bar chart (horizontal for many categories) | Revenue by product line |
| What is the distribution? | Histogram, box plot | Order value distribution |
| What is the proportion? | Pie chart (use sparingly), treemap | Revenue share by region |
| What are the key numbers? | KPI widget, gauge | Current month revenue, MoM change |
| Where are patterns in two dimensions? | Heat map, scatter plot | Orders by day of week and hour |
| What is the geographic pattern? | Map visual | Revenue by state or country |
| What are the details? | Pivot table, table | Transaction-level detail |
Dashboard Layout Best Practices
Top of dashboard — KPIs and summary. Place 3-5 KPI widgets showing the most important metrics with period-over-period comparison. This tells the viewer whether things are good or bad before they explore details.
Middle — Trends and comparisons. Line charts for time-series trends, bar charts for categorical comparisons. These answer “what is happening?” and “where should I look deeper?”
Bottom — Detail tables and drill-down. Tables and pivot tables for detailed data that viewers explore when they find something interesting in the charts above.
Filters — Top or left sidebar. Use filter controls (date range, category, region) that apply to all visuals on the sheet. This creates a consistent analytical context.
Interactive Features
- Parameters — User-selectable values that control visual behavior (e.g., select metric to display, toggle between absolute and percentage views)
- Actions — Click on a visual element to filter other visuals (e.g., click a bar in a revenue chart to filter the detail table below)
- Drill-down — Configure hierarchies (Year → Quarter → Month → Day) that users can navigate by clicking
- Conditional formatting — Color-code values based on thresholds (red for below target, green for above)
Embedded Analytics
QuickSight’s embedded analytics feature lets you integrate dashboards directly into your application — a powerful capability for SaaS products that need customer-facing analytics.
Embedding Options
| Option | Use Case | Authentication |
|---|---|---|
| Embedded dashboard | Read-only dashboard in your app | QuickSight embedding SDK |
| Embedded visual | Single chart in your app | QuickSight embedding SDK |
| Embedded Q bar | Natural language query in your app | QuickSight embedding SDK |
| Anonymous embedding | Public-facing dashboards (no login) | Capacity-based pricing |
Implementation Pattern
Your SaaS App (React/Angular) → QuickSight Embedding SDK → Generate Embed URL (via Lambda) → Render dashboard in iframe- User authenticates to your SaaS application
- Your backend calls QuickSight
GenerateEmbedUrlForRegisteredUserAPI - API returns a time-limited signed URL
- Frontend renders the dashboard using the QuickSight Embedding SDK
- Row-level security filters data to only show the authenticated user’s tenant data
Row-Level Security for Multi-Tenant SaaS
For SaaS applications, row-level security (RLS) ensures each tenant sees only their own data:
Dataset-based RLS:
Create a permissions dataset that maps users to their allowed data:
| UserName | TenantId |
|---|---|
| user-1@acme.com | TENANT-ACME |
| user-2@globex.com | TENANT-GLOBEX |
QuickSight automatically filters every query to include only rows matching the user’s tenant. This filtering is applied server-side — there is no way for a user to see another tenant’s data, regardless of how they interact with the dashboard.
Tag-based RLS:
For embedded analytics, pass tenant context as session tags when generating the embed URL:
{
  "SessionTags": [{ "Key": "TenantId", "Value": "TENANT-ACME" }]
}
The tag filters data at the dataset level. This approach scales better than user-based RLS because you do not need to maintain a mapping of every user to their tenant in QuickSight.
QuickSight Q: Natural Language Queries
QuickSight Q lets users ask questions in plain English:
- “What was total revenue last quarter?”
- “Show me the top 10 customers by order volume”
- “Compare revenue this month vs last month by region”
Q uses ML to interpret the question, map it to your dataset, and generate a visual answer.
Setup requirements:
- Build Topics that define your data’s business context (what “revenue” means, what “last quarter” resolves to)
- Define synonyms (revenue = sales = income)
- Set default aggregations and date granularities
Q is not a replacement for pre-built dashboards — it is a complement. Dashboards answer known questions consistently. Q answers ad-hoc questions that dashboard designers did not anticipate.
Cost Optimization
User Pricing
| User Type | Price | Best For |
|---|---|---|
| Author | $24/month (annual) or $34/month (monthly) | Dashboard creators, data analysts |
| Reader | $0.30/session, max $5/month | Dashboard consumers, executives, operations |
| Reader (capacity) | $250/month per session pack (500 sessions) | Embedded analytics, large reader populations |
Optimization strategies:
- Convert infrequent authors to readers (most users only view dashboards)
- Use capacity pricing for embedded analytics with predictable usage
- Share dashboards via email reports (scheduled PDF/CSV) for users who need data but not interactive exploration
SPICE Optimization
- Filter data before import — Only import the data your dashboards need. A 100 GB source table that produces a 5 GB dashboard dataset should be filtered at the dataset level, not imported in full.
- Aggregate at the source — If your dashboard shows daily summaries, aggregate to daily granularity before importing into SPICE. Do not import transaction-level data and aggregate in QuickSight.
- Use incremental refresh — For time-series data, incremental refresh is faster and more cost-effective than full refresh.
- Monitor SPICE usage — QuickSight provides SPICE capacity metrics. Set CloudWatch alarms for approaching capacity limits.
Dashboard Performance
- Limit visuals per sheet — Each visual generates a SPICE query. Dashboards with 20+ visuals load slowly. Split complex dashboards into multiple sheets.
- Use filters at the dataset level — Pre-filter data in the dataset definition rather than adding visual-level filters that run on every load.
- Avoid
SELECT *— In custom SQL data sources, specify only the columns your dashboard needs. Fewer columns means faster SPICE imports and smaller storage.
Common QuickSight Patterns
Pattern 1: Executive Dashboard
Data sources: Athena (data lake) + RDS (operational database) Refresh: Hourly SPICE refresh Audience: C-suite, 10-20 users (reader pricing)
Three sheets: Revenue overview (KPIs, trends, regional breakdown), Customer metrics (acquisition, churn, LTV), Operations (SLA adherence, incident count, deployment frequency).
Pattern 2: Operational Dashboard
Data source: Direct Query to RDS/Aurora Refresh: Real-time (Direct Query) Audience: Operations team, 5-10 users (reader pricing)
Single sheet with real-time metrics: active users, queue depth, error rate, system health. Uses conditional formatting for visual alerts (red when error rate exceeds threshold).
Pattern 3: Customer-Facing Analytics
Data source: Athena over S3 data lake Refresh: Daily SPICE refresh Audience: SaaS customers via embedded analytics (capacity pricing)
Embedded dashboards with row-level security. Each customer sees only their own usage data, performance metrics, and billing information. Tag-based RLS using session tags from the SaaS application’s authentication.
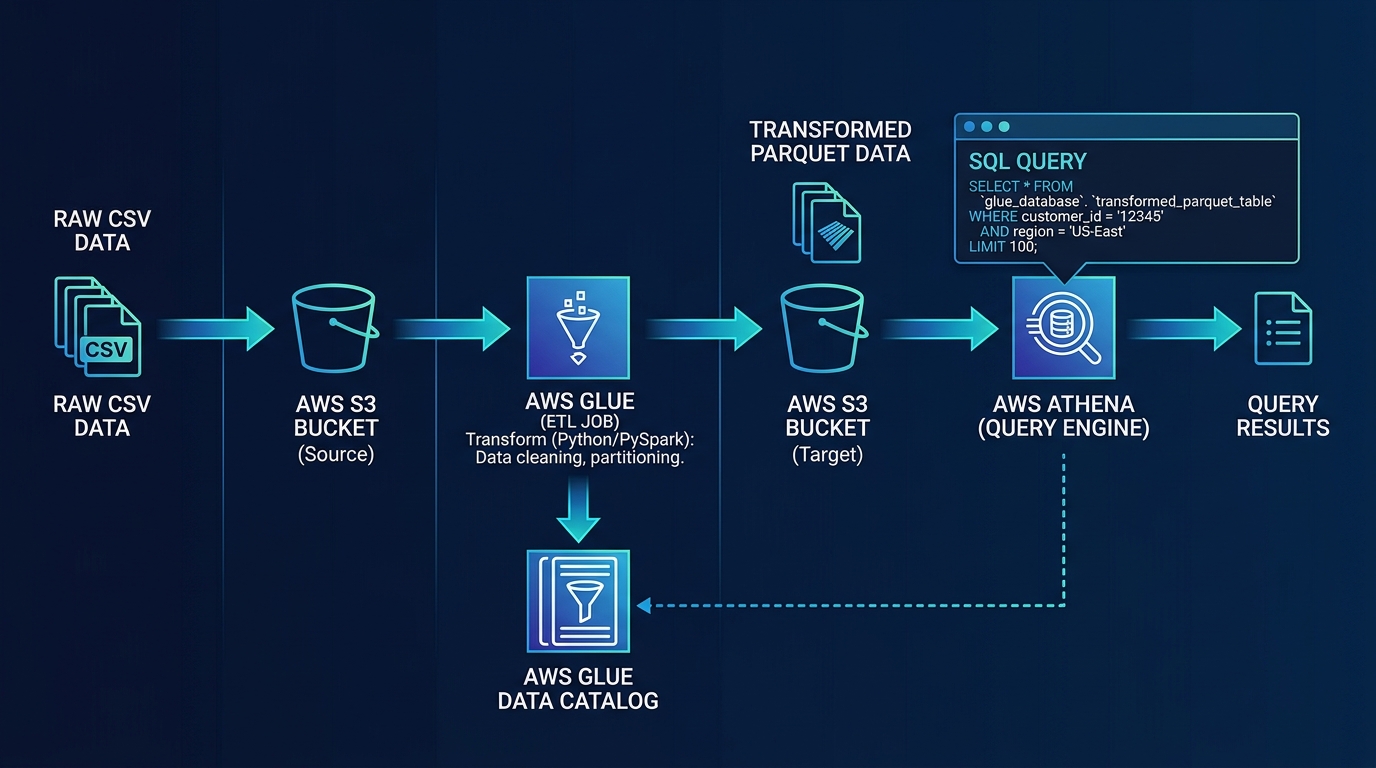
Integration with AWS Analytics Stack
QuickSight is most powerful as the visualization layer in a broader analytics architecture:
Data Sources → Kinesis/Glue → S3 Data Lake → Athena/Redshift → QuickSight- Kinesis Data Firehose — Streams operational data into S3 in near real-time
- AWS Glue — ETL jobs transform and catalog data in the data lake
- Amazon Athena — SQL queries over S3 data, no infrastructure
- Amazon Redshift — Data warehouse for complex analytical workloads
- QuickSight — Visualization and dashboard delivery to business users
Each layer handles its responsibility without duplicating functionality. Glue handles transformation, Athena and Redshift handle querying, and QuickSight handles visualization and access control.
Common Mistakes
Mistake 1: Using QuickSight as an ETL Tool
QuickSight’s data preparation features handle simple transformations, but complex data modeling belongs in Glue, dbt, or Athena views. If your QuickSight dataset definition has 200 lines of custom SQL, move that logic upstream.
Mistake 2: Too Many Visuals Per Dashboard
A dashboard with 25 charts is a spreadsheet with extra steps. Each sheet should answer one question clearly. Use sheets to organize related visuals (summary → detail → drill-down) and actions to link between them.
Mistake 3: Not Using SPICE for Shared Dashboards
A dashboard viewed by 50 people using Direct Query sends 50 queries to your production database every time someone opens it. SPICE caches the data and serves all 50 users without touching your source database.
Mistake 4: Ignoring Row-Level Security
For multi-tenant SaaS or any application where different users should see different data, configure RLS before sharing dashboards. It is much easier to set up RLS from the start than to retrofit it after users have already been granted access to unfiltered data.
Getting Started
QuickSight removes the infrastructure barrier to business intelligence. For most AWS organizations, it provides the analytics capabilities that business teams need at a cost that makes per-user BI accessible rather than exclusive.
For analytics architecture design, including data lake construction, ETL pipeline development, and QuickSight dashboard implementation, talk to our team.
AWS Cloud Architect & AI Expert
AWS-certified cloud architect and AI expert with deep expertise in cloud migrations, cost optimization, and generative AI on AWS.