Retail Omnichannel Analytics on AWS (2026): Lakehouse, KPI Catalog, and Streaming Lanes
Quick summary: For a specialty retailer (~380 stores, 2.4M loyalty members), S3 Tables Iceberg silver plus Kinesis cart events cut dashboard refresh from 26 hours to 22 minutes — conversion reporting error dropped from 11% to 2%.
Key Takeaways
- For a specialty retailer (~380 stores, 2
- 4M loyalty members), S3 Tables Iceberg silver plus Kinesis cart events cut dashboard refresh from 26 hours to 22 minutes — conversion reporting error dropped from 11% to 2%
- Benchmark pattern (not a cited client) — Specialty retailer, ~380 stores, 2
- 4M loyalty members, Shopify Plus + legacy POS, nightly-only warehouse (dashboard refresh 26 hours)
- Phase 1: ERP/WMS → Glue → S3 Tables silver Iceberg
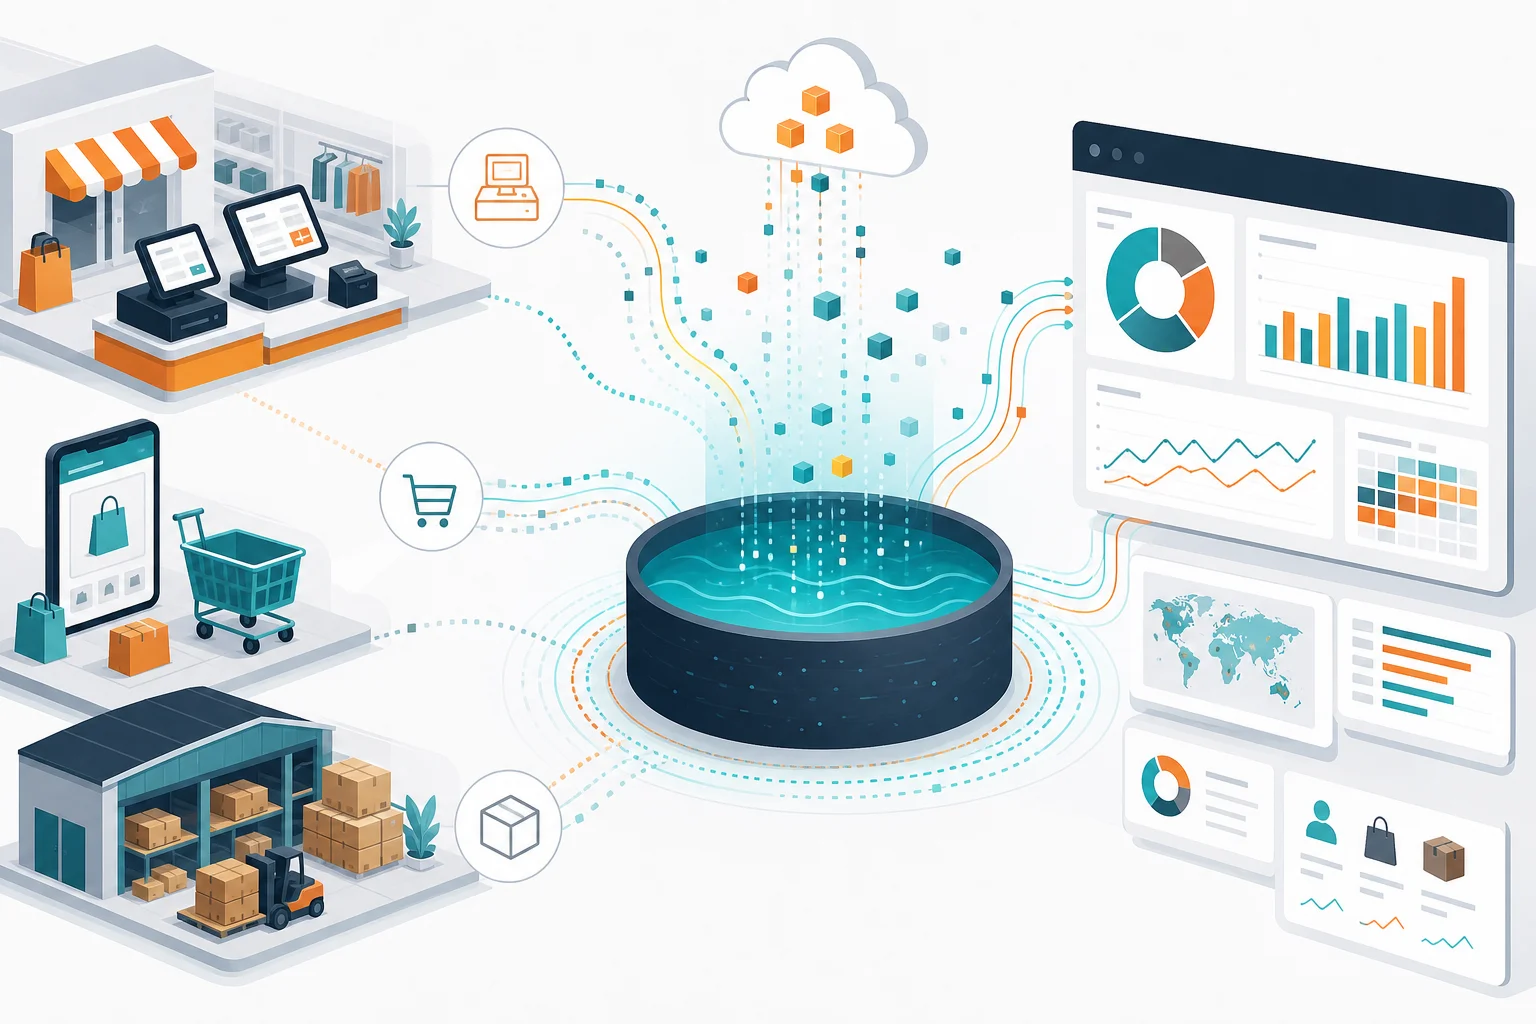
Table of Contents
Amazon S3 Tables is purpose-built managed Apache Iceberg storage — AWS documents up to 3× faster query performance and up to 10× more transactions per second versus self-managed Iceberg, with automatic compaction (S3 Tables features). For omnichannel retailers merging POS, e-commerce, loyalty, and WMS feeds, that compaction difference shows up as Athena bill stability during promotion weeks — not just query speed.
This post is the retail omnichannel analytics reference architecture — bronze/silver/gold lanes, streaming vs batch decision matrix, and a QuickSight KPI catalog. It is not retail peak traffic scaling, not the retail industry overview, not logistics supply chain, and not generic data lake setup (though you will reuse Glue patterns from there).
Artifacts: retail KPI catalog CSV, analytics lane decision matrix.
Benchmark pattern (not a cited client) — Specialty retailer, ~380 stores, 2.4M loyalty members, Shopify Plus + legacy POS, nightly-only warehouse (dashboard refresh 26 hours). Phase 1: ERP/WMS → Glue → S3 Tables silver Iceberg. Phase 2: cart + POS stream → Kinesis → Firehose → silver MERGE. Dashboard refresh 26h → 22 min; conversion reporting error 11% → 2% after identity resolution in silver.
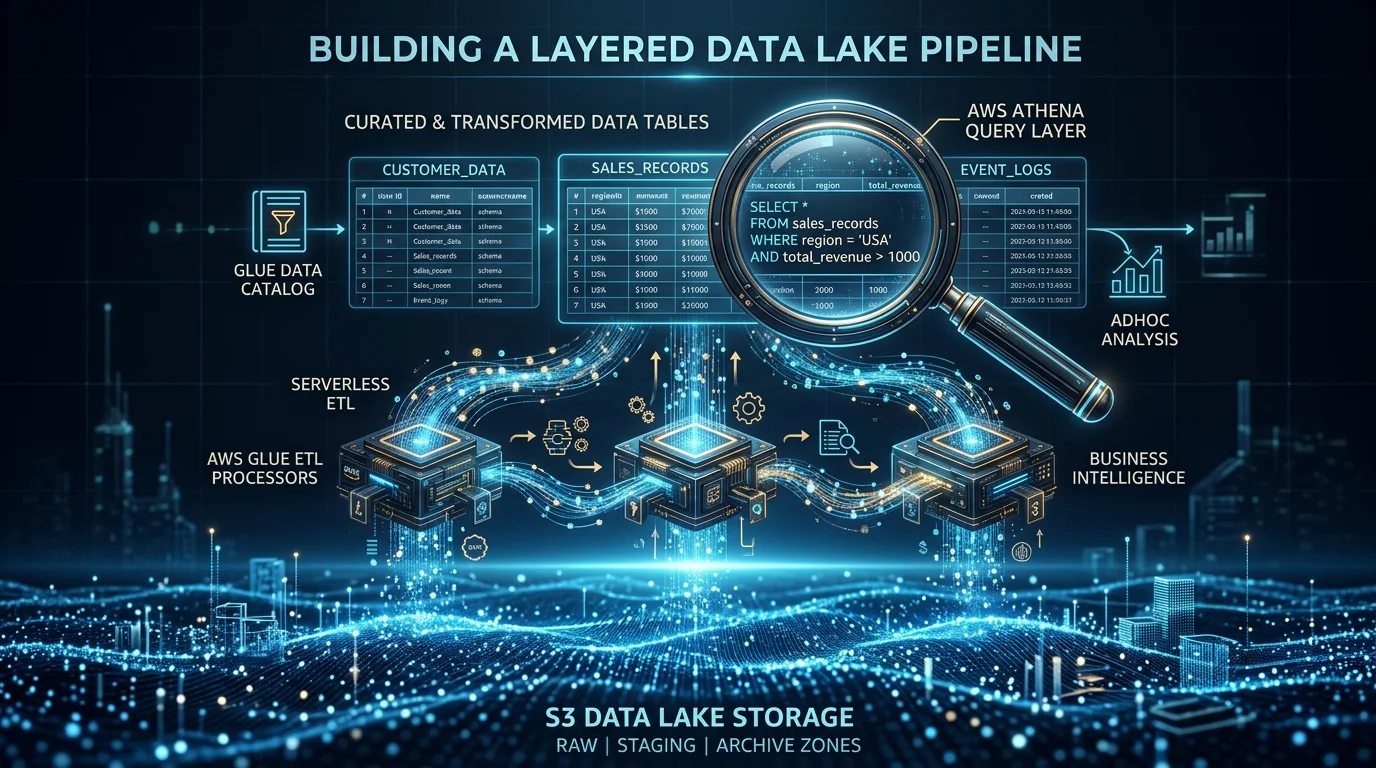
Reference architecture
POS / stores ──────┐
E-commerce (Shopify)─┼──► Kinesis (real-time) ──► Firehose ──► S3 Tables bronze
WMS / ERP ─────────┘         │                           │
                             │                           ▼
Loyalty CRM ──► Glue batch ──┴──► S3 Tables silver (Iceberg)
                                        │
                                        ├──► Athena / Spark
                                        └──► QuickSight (SPICE + direct)
Opinionated take: Silver identity resolution before gold KPIs. Retailers that build gold conversion_rate on bronze web sessions without loyalty bridge tables ship dashboards the merchandising team stops trusting within one quarter.
Lane selection — streaming vs batch
Use analytics-lane-decision.md for full rules. Summary:
| Data product | Default lane | Rationale |
|---|---|---|
| Cart / browse events | Kinesis → Firehose | Sub-hour abandonment triggers |
| POS transactions | Kinesis or 15-min Glue | Store hours need near-real-time comp |
| ERP inventory | Daily Glue | Snapshot semantics |
| Loyalty tier | Daily Glue | Low change frequency |
| Campaign attribution | Hourly stream or batch | Depends on ad platform API cadence |
Silver layer — S3 Tables Iceberg
AWS Glue 5 + S3 Tables per AWS Big Data Blog Aurora-to-S3-Tables pattern:
-- Context: Athena engine v3, Iceberg table in S3 Tables namespace (July 2026)
CREATE TABLE retail_silver.order_events (
event_id string,
channel string,
loyalty_id string,
sku string,
event_ts timestamp,
revenue decimal(12,2)
)
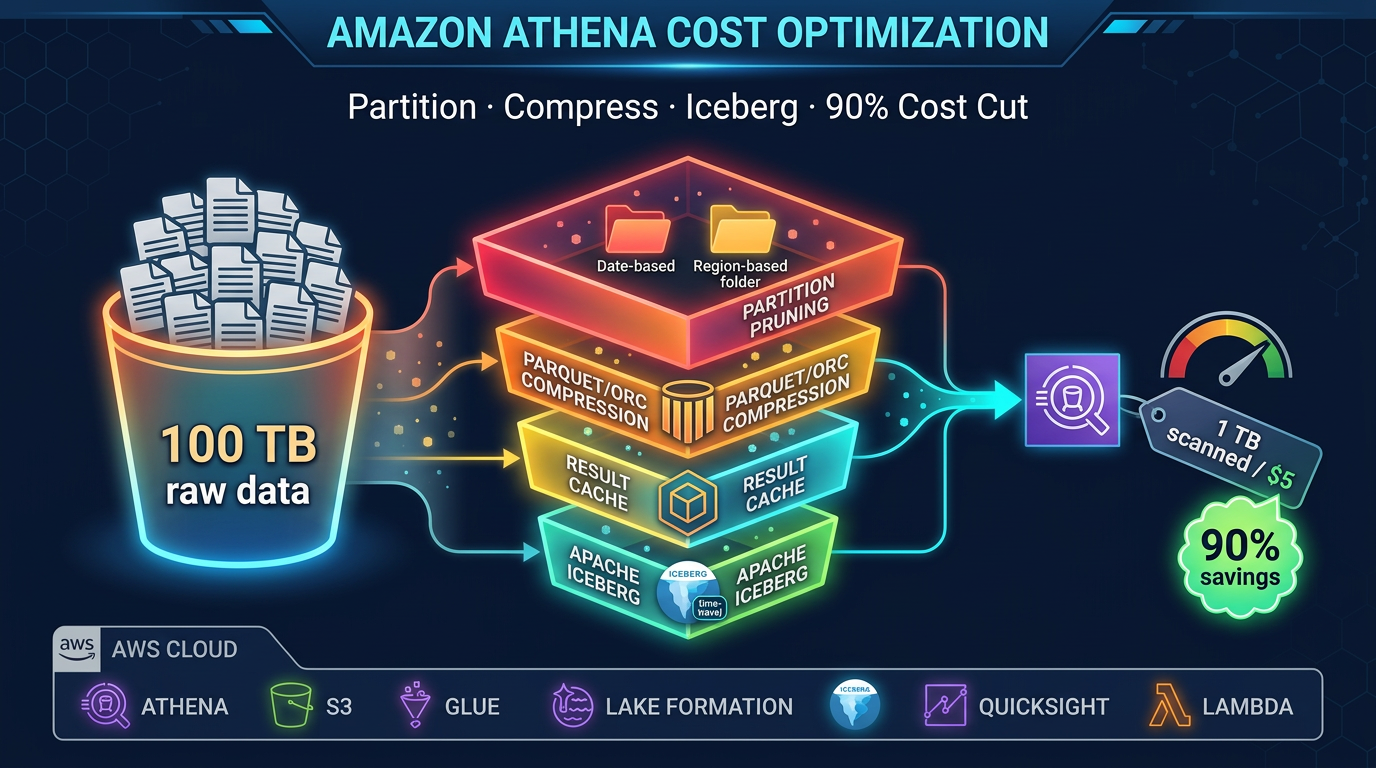
PARTITIONED BY (day(event_ts))
TBLPROPERTIES ('table_type' = 'ICEBERG');Partition on day(event_ts) for promotion-week pruning — see Athena Iceberg cost guide.
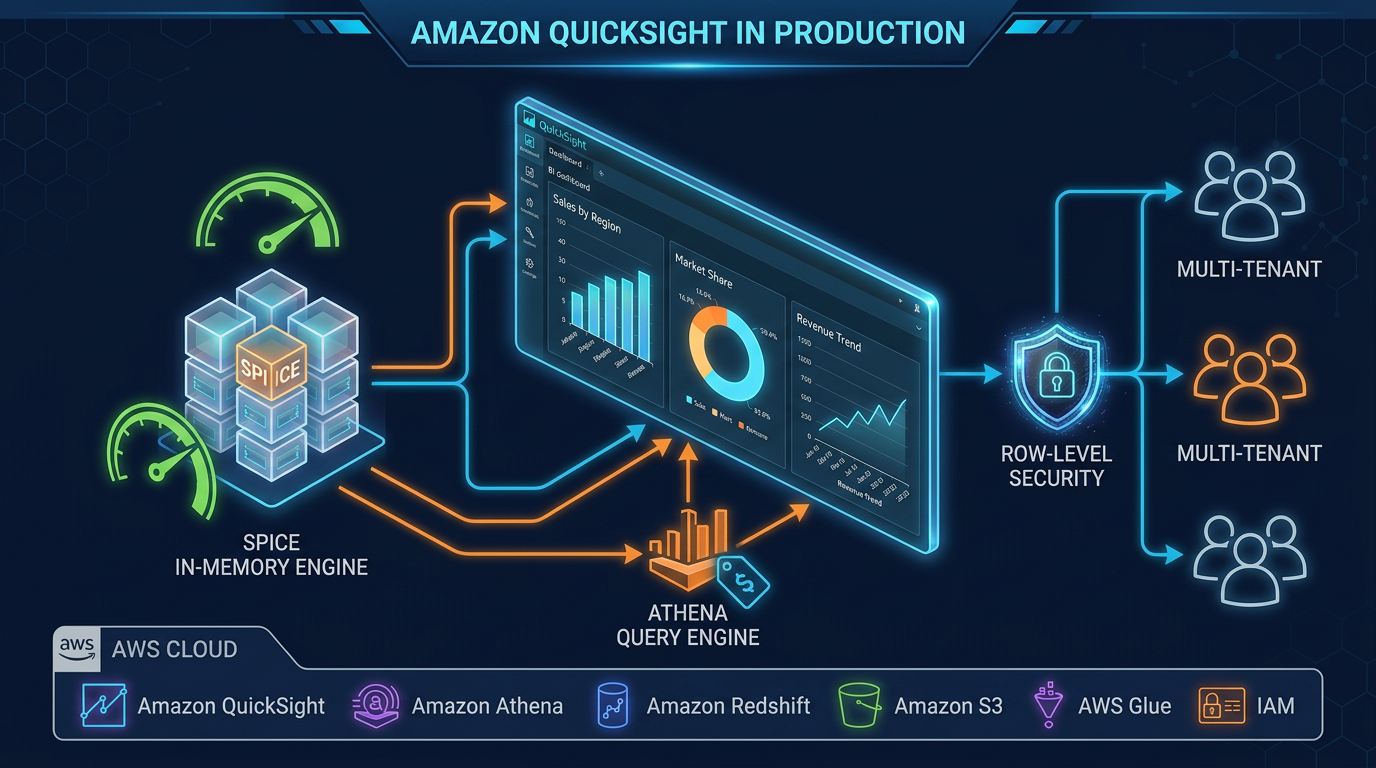
QuickSight KPI catalog
Import retail-kpi-catalog.csv as your dashboard backlog. Minimum viable executive set:
| KPI | SPICE or direct | Owner |
|---|---|---|
conversion_rate | SPICE (hourly refresh) | Merchandising |
cart_abandonment | SPICE | E-commerce |
sku_velocity | Direct query | Inventory |
loyalty_redemption_rate | SPICE | Marketing |
inventory_fill_rate | Direct query | Supply chain |
Wire Amazon Q in QuickSight only after KPI definitions are steward-approved — GenBI on ambiguous metrics amplifies distrust.
Identity resolution — the omnichannel hinge
What broke — Week 2 post-launch. Web
session_idjoined to POSreceipt_idvia email string match. 11% of transactions double-counted when households shared email; 6% dropped when POS masked emails. Detection:conversion_rateexceeded 100% for two store regions in QuickSight. Fix: silveridentity_bridgetable keyed onloyalty_idwithemail_hash(SHA-256 salted) as secondary — POS and web both emit loyalty scan when present. Rollback: reverted gold views to store-only channel reporting for 48h while bridge backfilled.
Cost guardrails
- Kinesis: 1 shard per ~1k writes/sec sustained; scale shards before Black Friday, not on the day
- S3 Tables: leverage managed compaction — still monitor Athena scanned bytes per KPI
- SPICE: cap datasets at 10M rows per QuickSight production guide; spill to direct query for SKU drill-down
What to Do This Week
- Inventory sources: POS, e-commerce, loyalty, WMS — document refresh latency today.
- Download retail-kpi-catalog.csv; assign owners to five KPIs.
- Stand up one Kinesis stream for cart events → Firehose → S3 Tables bronze — prove 22-minute refresh on a single dashboard.
- Build
identity_bridgebefore any omnichannel conversion metric. - Schedule daily row-count reconciliation: source vs silver.
Reproduce this — Clone KPI definitions from retail-kpi-catalog.csv. Apply lane rules from analytics-lane-decision.md to your source list. Track refresh latency before/after in a spreadsheet column.
What This Post Doesn’t Cover
- Demand forecasting with SageMaker Forecast — see logistics planning tier for adjacent patterns
- Retail peak traffic and auto-scaling — see Black Friday architecture
- Data governance council and catalog — see governance operating model
- Clean Rooms for retail media networks — see AWS Clean Rooms
We have not load-tested Kinesis shard limits above 8k events/sec for this silhouette — scale shard count using AWS calculator before Cyber Week.
AWS Cloud Architect & AI Expert
AWS-certified cloud architect and AI expert with deep expertise in cloud migrations, cost optimization, and generative AI on AWS.