CloudWatch RUM and Core Web Vitals (2026): When Real-User Data Beats Synthetics Alone
Quick summary: Synthetics prove a journey works from AWS; RUM shows what real browsers experience — LCP, CLS, INP. Sampling, privacy, cost, and when Application Signals still owns backend SLOs.
Key Takeaways
- Synthetics prove a journey works from AWS; RUM shows what real browsers experience — LCP, CLS, INP
- On July 22, 2026, backend SLOs can be green while users on slow mobile networks still bounce
- CloudWatch RUM (Real User Monitoring) closes that gap by collecting Core Web Vitals — LCP, CLS, INP — and related page performance from real browsers
- Setup Essentials 1
- 2
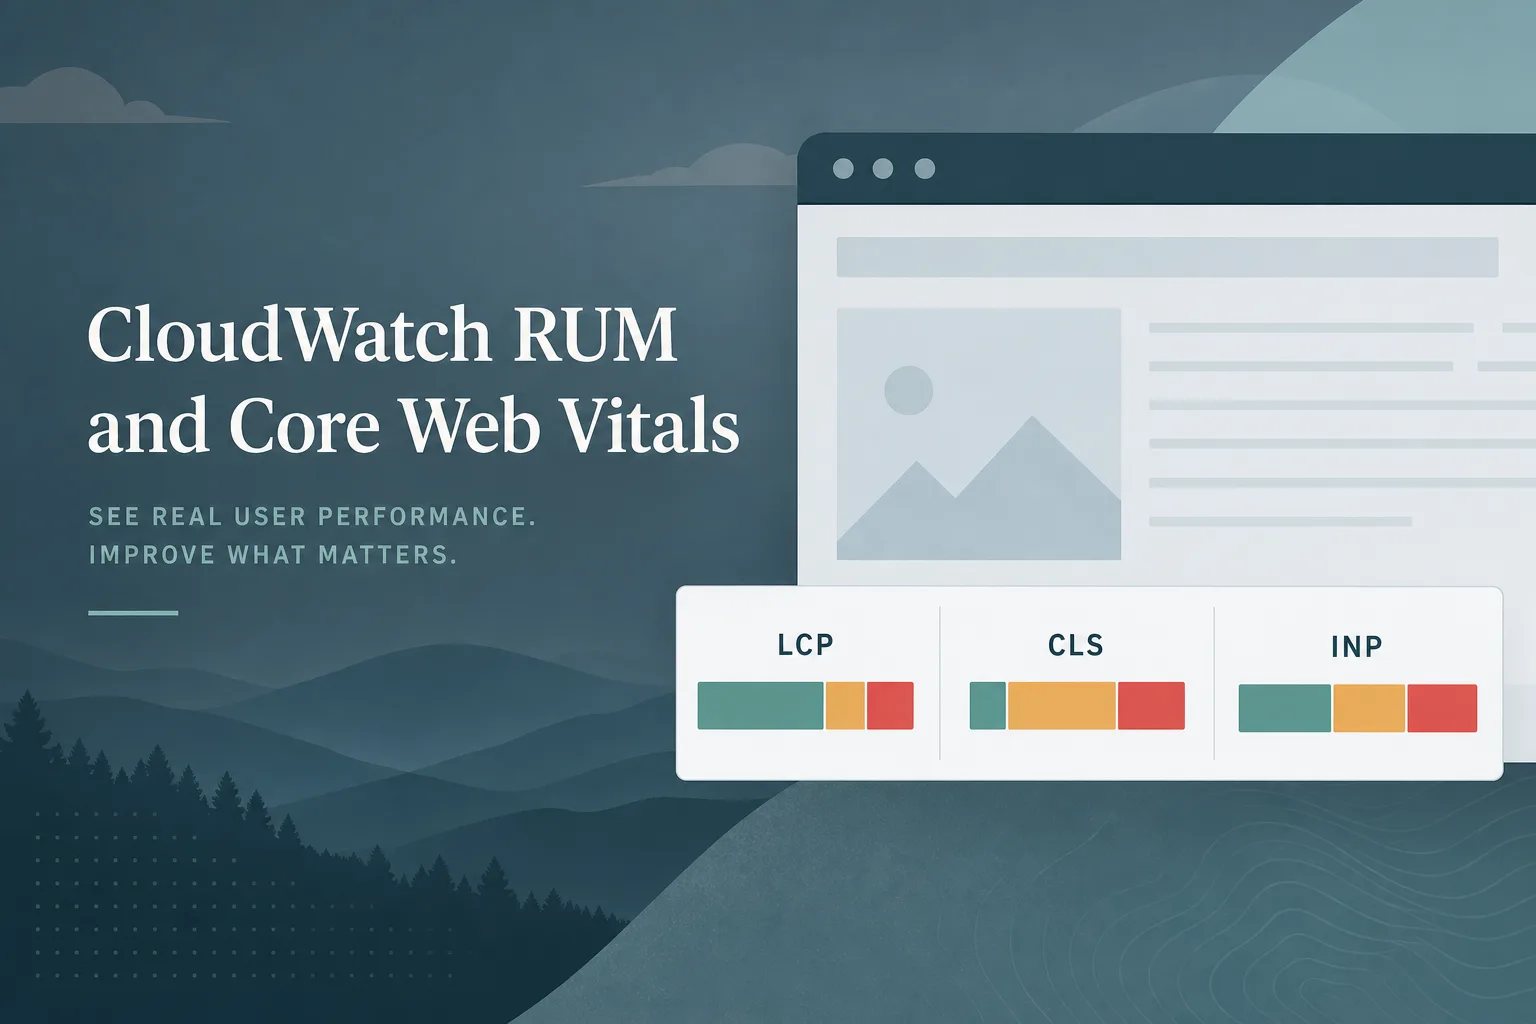
Table of Contents
On July 22, 2026, backend SLOs can be green while users on slow mobile networks still bounce. CloudWatch RUM (Real User Monitoring) closes that gap by collecting Core Web Vitals — LCP, CLS, INP — and related page performance from real browsers. It does not replace Synthetics canaries or Application Signals; it answers a different question: what did users actually experience?
RUM vs Synthetics vs Application Signals
| Signal | Answers | Blind spot |
|---|---|---|
| Synthetics | “Does the journey work from our probe?” | Not real devices/networks |
| RUM | “What did browsers measure?” | Sampling, blockers, low traffic |
| Application Signals | “Is the backend healthy?” | Not front-end paint/layout |
Opinionated take: Tier-1 products need all three on the same named journeys — but page primarily on Synthetics fail + Application Signals SLO burn; use RUM for performance regressions and release gates (monitoring vs alerting).
Reproduce this — Complete the RUM checklist: app monitor, domain allow-list, sampling %, privacy scrub, and
effective events ≈ sessions × events × samplingbefore you enable alarms.
Setup Essentials
- Create an app monitor per Region that serves traffic.
- Pin the web client version (snippet or package).
- Restrict to known domains.
- Set sampling deliberately — start conservative.
- Document Cognito / auth mode so rotates do not silently stop collection.
Core Web Vitals as Alarms
Alert on sustained regressions (for example LCP p75 above your budget for N periods), not single-session outliers. Tie release freezes to error budgets the same way you do for availability (SLA/SLO guide).
What broke — A marketing launch 5×’d sessions with RUM at high sampling and verbose custom page attributes (including query strings). Event volume — and cost — spiked; dashboards lagged. Fix: drop PII-bearing attributes, cut sampling, keep Synthetics for availability pages. Performance signal remained; bill returned to plan.
Cost and FinOps
RUM is an event meter. Re-forecast after campaigns. Stack-level CloudWatch cost still dominated by logs for many accounts — use the observability stack calculator and CloudWatch pricing breakdown.
Privacy
Scrub tokens and emails from URLs and custom attributes. Respect consent banners. Treat RUM config as a security review item, not only a performance one.
What to Do This Week
- Decide if you have a front-end performance SLO (LCP/INP) worth measuring.
- Enable RUM with low sampling on production using the checklist.
- Correlate one slow page with Application Signals backend latency for the same API.
- Keep Synthetics as the availability page source of truth.
- Need implementation help? Managed services or contact us.
What This Post Doesn’t Cover
- Full competitive matrix vs Datadog RUM / FullStory session replay.
- Mobile native (iOS/Android) RUM agents beyond web.
- Detailed CWV optimization techniques (image CDN, hydration) — performance engineering beyond collection.
Frequently asked questions
What is CloudWatch RUM?
When should I NOT rely on RUM alone?
How does RUM differ from Application Signals?
What drives CloudWatch RUM cost?
What could go wrong with RUM privacy settings?
Should every SPA enable 100% RUM sampling?

AWS Cloud Architect & AI Expert
AWS-certified cloud architect and AI expert with deep expertise in cloud migrations, cost optimization, and generative AI on AWS.