AWS Bill Teardown #4: Multi-Account Commitment Leakage — Savings Plans Bought in the Payer, Consumed in the Wrong OU
Quick summary: A 22-account AWS Organization spent $1.1M/yr on Compute Savings Plans but applied only 61% to production — dev sandboxes burned the commit while prod stayed On-Demand. Group Sharing (April 2026) fixed attribution; the waste was $312k/yr before they restructured purchases.
Key Takeaways
- A 22-account AWS Organization spent $1
- 1M/yr on Compute Savings Plans but applied only 61% to production — dev sandboxes burned the commit while prod stayed On-Demand
- Group Sharing (April 2026) fixed attribution; the waste was $312k/yr before they restructured purchases
- On April 21, 2026, AWS shipped Savings Plans Group Sharing — Prioritized and Restricted modes that route commitment discounts to the accounts you intend
- This teardown is about the year before that fix, when a payer-level 3-year Compute Savings Plan looked healthy in aggregate while production bled On-Demand spend
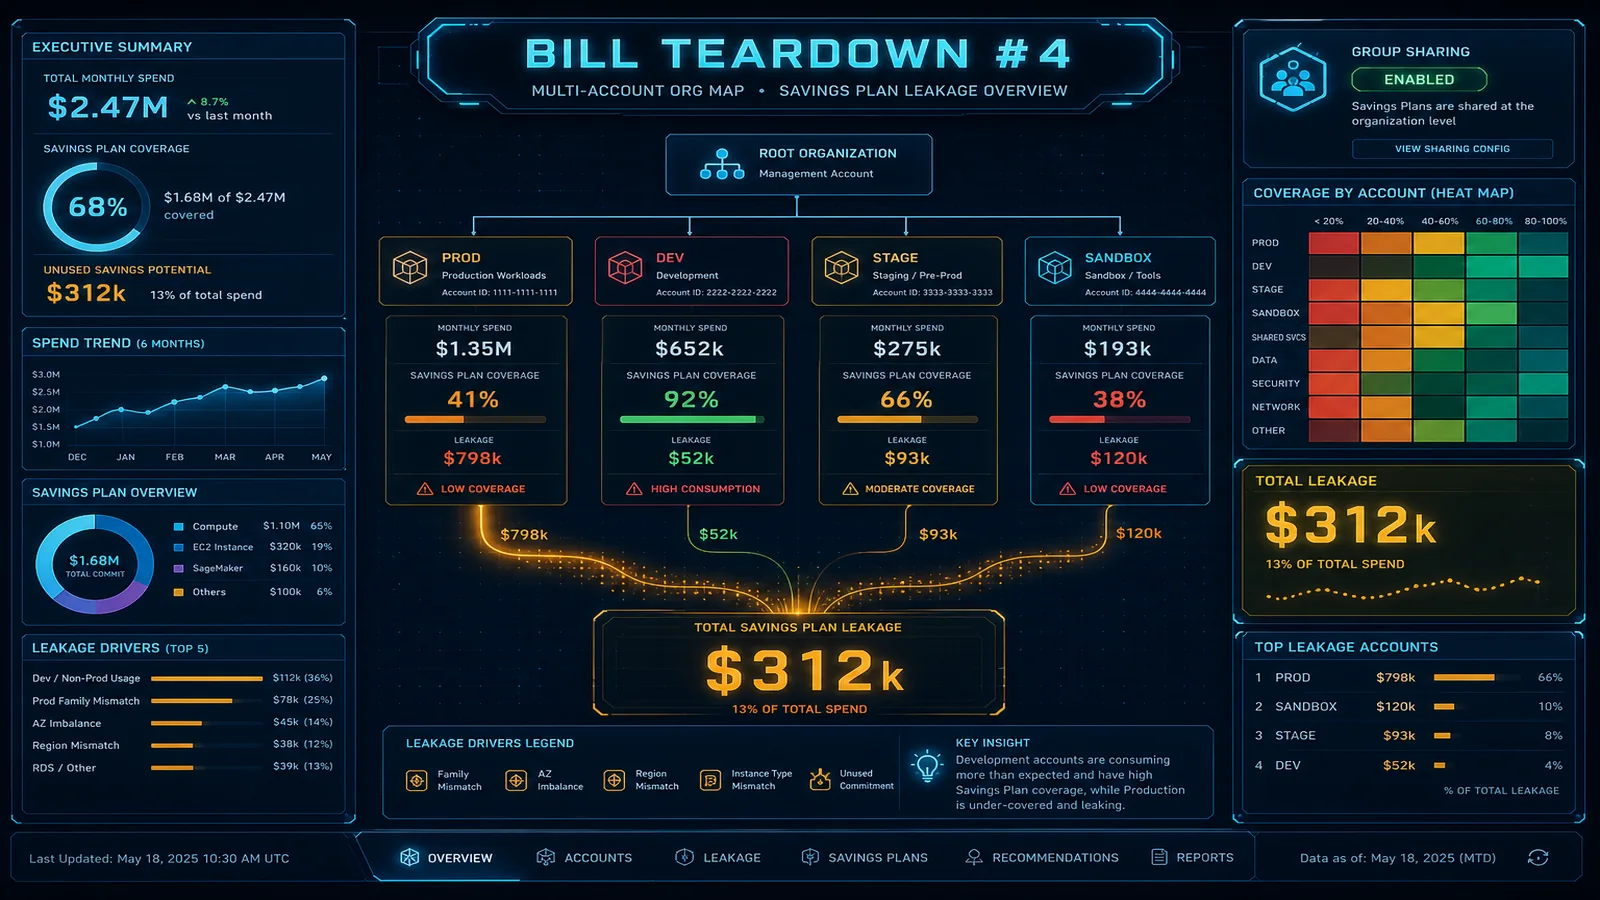
Table of Contents
On April 21, 2026, AWS shipped Savings Plans Group Sharing — Prioritized and Restricted modes that route commitment discounts to the accounts you intend. This teardown is about the year before that fix, when a payer-level 3-year Compute Savings Plan looked healthy in aggregate while production bled On-Demand spend.
Account snapshot (anonymized)
| Attribute | Value |
|---|---|
| Industry | B2B SaaS + internal data platform |
| Linked accounts | 22 |
| Steady-state AWS spend | ~$920k/mo |
| Compute SP commitment | ~$1.1M/yr effective rate |
| SP utilization (payer view) | 94% |
| Production SP coverage | 61% |
Finding 1: Commitment followed convenience, not spend
FinOps purchased SP at the management account in 2024 using blended organization usage. Over 18 months, sandbox and CI accounts grew from 12% to 31% of compute hours — ephemeral environments with high churn consumed SP hours that could not be reclaimed for long-running prod clusters.
Monthly leakage modeled: production On-Demand premium ~$26k/mo above what coverage would cost if SP followed prod accounts → ~$312k/yr.
Finding 2: No Cost Category guardrails
Environment=dev workloads lacked automated shutdown; SP did not distinguish dev from prod because purchases were not tied to Cost Categories. Tag coverage on EC2 was 78% — good — but SP benefit allocation ignored tags until Group Sharing policies existed.
Finding 3: RDS still 100% On-Demand
While fighting EC2 SP leakage, $140k/mo RDS had zero Reserved Instances. Compute SP does not apply to RDS — a separate 1-year No-Upfront RI program on stable Multi-AZ primaries modeled $38k/mo additional savings unrelated to the SP fix.
Remediation (90 days)
- Enabled Restricted Group Sharing — prod OU consumes SP first; sandboxes excluded from primary commit.
- Bought a smaller 1-year No-Upfront SP scoped to non-prod for baseline CI, capped at 40% of dev compute.
- Purchased RDS RIs on three largest primaries after 30-day utilization proof.
- Weekly coverage-by-account report from CUR 2.0 → Slack
#finops. Query patterns: CUR 2.0 and Athena FinOps queries.
After
| Metric | Before | After |
|---|---|---|
| Prod SP coverage | 61% | 89% |
| On-Demand prod compute premium | $26k/mo | $7k/mo |
| RDS On-Demand share | 100% | 62% |
| Modeled annual savings | — | ~$340k |
Takeaway
Aggregate SP utilization is a vanity metric. Until benefits land on the accounts that own prod revenue, you are subsidizing sandbox sprawl. After April 2026, configure Group Sharing before the next commitment signature — not after the quarterly review surprises you.
Model commitments — Savings Plans ROI Calculator · Commitment Level Optimizer · Free cost audit
Previous: Teardown #3 — Retail data transfer. Hub: AWS cost optimization resources.
AWS Cloud Architect & AI Expert
AWS-certified cloud architect and AI expert with deep expertise in cloud migrations, cost optimization, and generative AI on AWS.